Add Textures to Seaborn Bar Plot in Python
In this tutorial, you’ll learn how to add textures to Seaborn bar plots using Matplotlib.
We’ll start by looking at different hatch patterns and how to apply them, then move on to combining these patterns for greater visual impact.
Finally, we’ll add an interactive and dynamic layer to the plots by using animation.
Exploring Different Hatch Patterns
First, ensure you have Seaborn installed. You can install it via pip:
!pip install seaborn
Now, let’s import the necessary libraries and prepare a sample dataset.
import seaborn as sns
import matplotlib.pyplot as plt
import pandas as pd
import numpy as np
data = {
    'Category': ['A', 'B', 'C', 'D'],
    'Value': [23, 45, 56, 78]
}
df = pd.DataFrame(data)
sns.barplot(x='Category', y='Value', data=df)
plt.show()
Output:

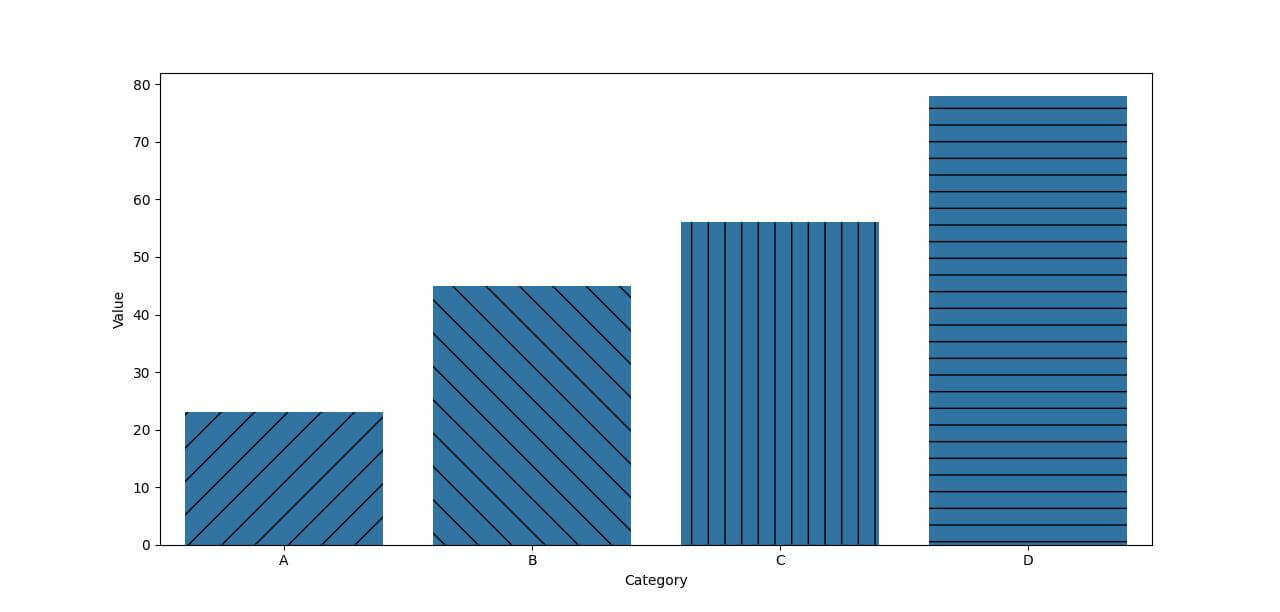
Next, let’s add standard hatch patterns to these bars. Hatch patterns are simple yet effective in differentiating between categories or groups.
hatch_patterns = ['/', '\\', '|', '-', '+', 'x', 'o', 'O', '.', '*']
plt.figure(figsize=(10, 6))
for i, bar in enumerate(sns.barplot(x='Category', y='Value', data=df).patches):
    bar.set_hatch(hatch_patterns[i % len(hatch_patterns)])
plt.show()
Output:
Adjust Texture Properties
Adjusting texture properties like size, density, and angles improve the readability and appeal of your plots.
Let’s continue with our existing Seaborn bar plot and experiment with these texture properties.
sns.set(style="whitegrid")
ax = sns.barplot(x="Category", y="Value", data=df)
for i, bar in enumerate(ax.patches):

    # Adjust hatch size, density, and angle
    hatch = ['/', '|', '+', 'x']
    bar.set_hatch(3 * hatch[i % len(hatch)])  # Increasing density
    bar.set_edgecolor('black')  # Enhancing visibility
    bar.set_linewidth(1.5)  # Adjusting line width for clarity
plt.show()
Output:
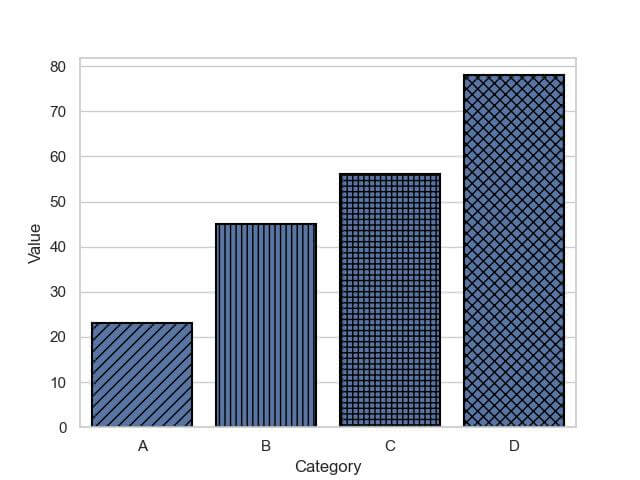
The set_linewidth and set_edgecolor methods are used to enhance the visibility of the textures, making them more pronounced and easier to differentiate.
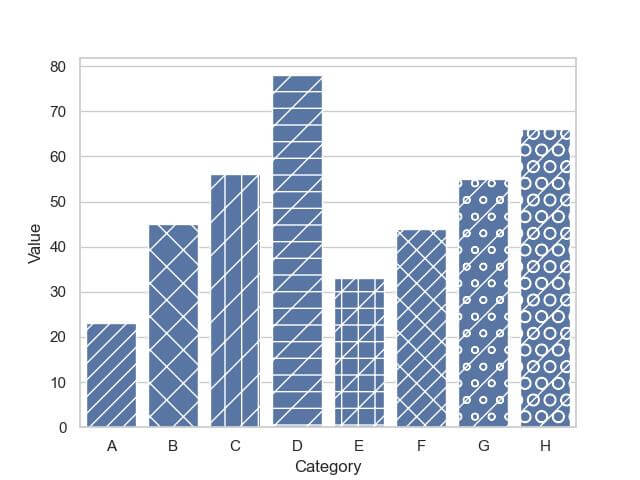
Combine Multiple Hatch Patterns
Continue using the same sample dataset, but this time, let’s add a twist by combining hatch patterns for each bar.
data = {
    'Category': ['A', 'B', 'C', 'D', 'E', 'F', 'G', 'H'],
    'Value': [23, 45, 56, 78, 33, 44, 55, 66]
}
df = pd.DataFrame(data)
sns.set(style="whitegrid")
ax = sns.barplot(x='Category', y='Value', data=df)
hatch_patterns = ['/', '\\', '|', '-', '+', 'x', 'o', 'O']
combined_hatches = [h1 + h2 for h1 in hatch_patterns for h2 in hatch_patterns]
for bar, pattern in zip(ax.patches, combined_hatches):
    bar.set_hatch(pattern)
plt.show()
Output:
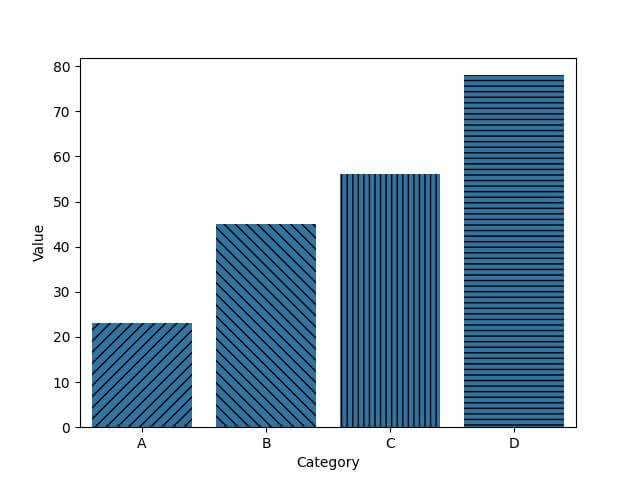
Animating Textures
For animation, we need to use Matplotlib’s animation module. Also, we’ll use interactive widgets for hover effects.
First, let’s import the necessary libraries:
import seaborn as sns
import matplotlib.pyplot as plt
import matplotlib.animation as animation
from matplotlib.widgets import Cursor  # For hover effects
Let’s create a simple animation where the hatch patterns of the bars change over time.
fig, ax = plt.subplots()
sns.barplot(x="Category", y="Value", data=df, ax=ax)
hatch_patterns = ['/', '\\', '|', '-', '+', 'x']
def animate(i):
    for bar, pattern in zip(ax.patches, hatch_patterns):
        bar.set_hatch(pattern * (i % len(hatch_patterns)))
ani = animation.FuncAnimation(fig, animate, frames=10, interval=500, repeat=True)
plt.show()
Output:
Mokhtar is the founder of LikeGeeks.com. He is a seasoned technologist and accomplished author, with expertise in Linux system administration and Python development. Since 2010, Mokhtar has built an impressive career, transitioning from system administration to Python development in 2015. His work spans large corporations to freelance clients around the globe. Alongside his technical work, Mokhtar has authored some insightful books in his field. Known for his innovative solutions, meticulous attention to detail, and high-quality work, Mokhtar continually seeks new challenges within the dynamic field of technology.