Using Seaborn Markers in Python Data Visualization
Markers allow you to distinguish data points, highlight trends, and provide a deeper understanding of the data.
In this tutorial, you’ll learn how to use markers in Seaborn, including different marker types, customizing markers, and marker mapping.
Marker Types
Built-in Markers
Seaborn supports a wide array of built-in markers.
Code:
import seaborn as sns
import matplotlib.pyplot as plt
data = {"Category": ["A", "B", "C", "D"], "Value": [10, 15, 7, 10]}

# Using circle marker
sns.scatterplot(x="Category", y="Value", data=data, marker='o')
plt.title("Scatter Plot with Circle Markers")
plt.show()

# Using square marker
sns.scatterplot(x="Category", y="Value", data=data, marker='s')
plt.title("Scatter Plot with Square Markers")
plt.show()
Output:
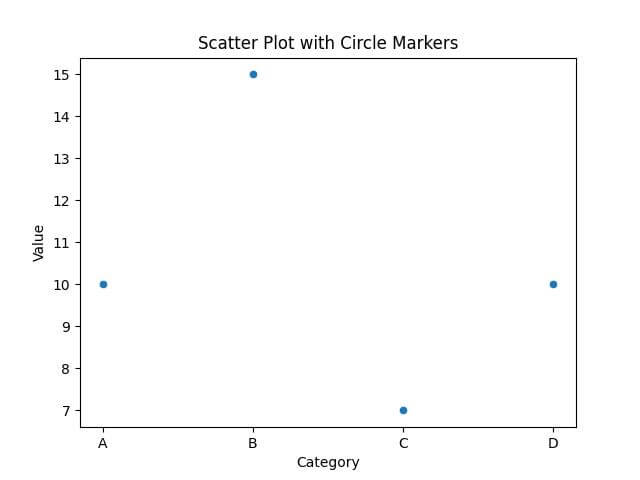
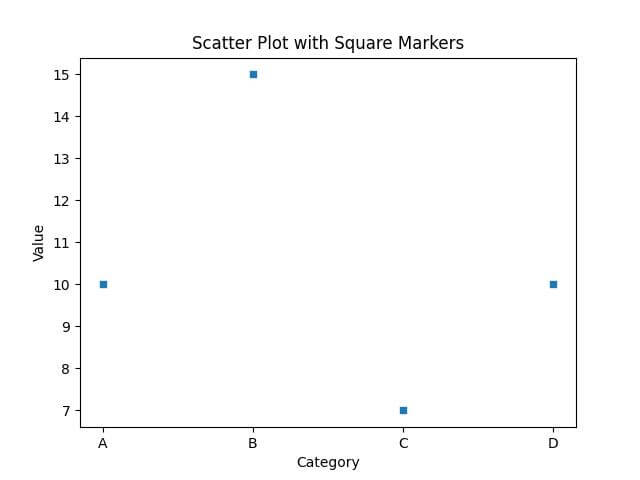
The first plot uses circle markers, while the second one uses square markers.
The built-in markers available in Seaborn are:
'o': Circle'.': Point',': Pixel'x': X'X': X (filled)'+': Plus'P': Plus (filled)'s': Square'd': Thin diamond'D': Diamond'p': Pentagon'H': Hexagon'h': Hexagon'v': Triangle down'^': Triangle up'<': Triangle left'>': Triangle right'1': Tri down'2': Tri up'3': Tri left'4': Tri right'8': Octagon'_': Horizontal line'|': Vertical line'None',' 'or'': Nothing- A tuple
(verts, 0): The first element of the tuple is the marker path vertices, and the second element is the marker path codes.
Custom Markers
You can create custom markers using strings, paths, or lists of vertices.
Code:
import pandas as pd
import seaborn as sns
import matplotlib.pyplot as plt
from matplotlib.markers import MarkerStyle
from matplotlib.path import Path
data = {"Category": ["A", "B", "C", "D"], "Value": [10, 15, 7, 10]}
df = pd.DataFrame(data)
star = MarkerStyle(marker=Path.unit_regular_star(5))

# Here, we use the index of the DataFrame as the x-coordinate for the scatter plot
sns.scatterplot(x=range(len(df['Category'])), y='Value', data=df, marker=star, s=200)
plt.xticks(range(len(df['Category'])), df['Category'])
plt.xlabel('Category')
plt.ylabel('Value')
plt.show()
Output:
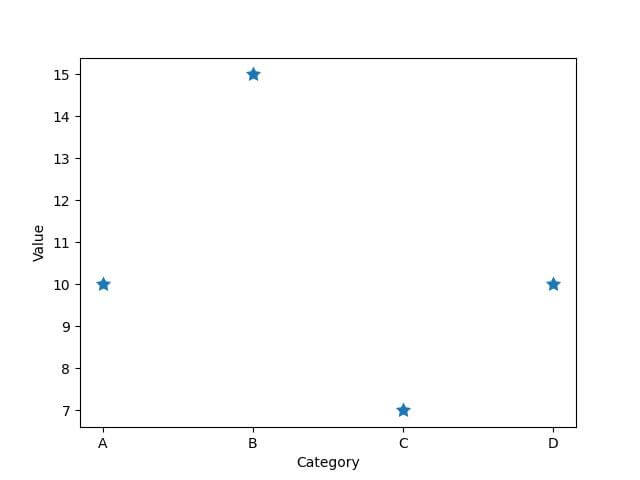
This code shows how to create a custom star-shaped marker using matplotlib Path.
Markers in Line Plot
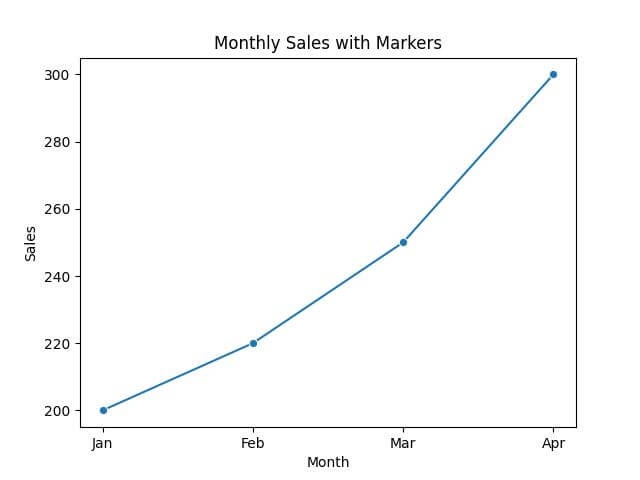
You can add markers to line plots to highlight each data point.
Code:
import seaborn as sns
import matplotlib.pyplot as plt
data = {"Month": ["Jan", "Feb", "Mar", "Apr"], "Sales": [200, 220, 250, 300]}
sns.lineplot(x="Month", y="Sales", data=data, marker='o')
plt.title("Monthly Sales with Markers")
plt.show()
Output:
Customize Marker Size
You can use the s parameter to adjust the marker size.
Code:
import seaborn as sns
import matplotlib.pyplot as plt
data = {"Category": ["A", "B", "C", "D"], "Value": [10, 15, 7, 10]}

# Scatter plot with varying marker sizes
sns.scatterplot(x="Category", y="Value", data=data, s=200)
plt.title("Scatter Plot with Custom Marker Sizes")
plt.show()
Output:
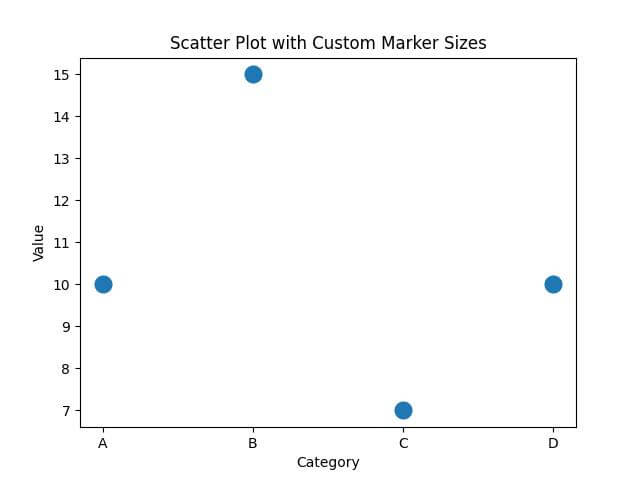
In this example, the size of the markers is 200.
Marker Mapping
To create marker mapping in Seaborn, you can use the markers parameter in the sns.scatterplot() function.
Code:
import seaborn as sns
import matplotlib.pyplot as plt
import pandas as pd
data = pd.DataFrame({
    'Value': [10, 20, 15, 30, 25, 35, 40, 45, 30, 50],
    'Category': ['A', 'B', 'A', 'B', 'A', 'B', 'A', 'B', 'A', 'B'],
    'Group': ['X', 'X', 'Y', 'Y', 'Z', 'Z', 'X', 'X', 'Y', 'Y']
})

# Define marker mapping
marker_map = {'X': 'o', 'Y': '^', 'Z': 's'}
sns.scatterplot(x='Category', y='Value', data=data, hue='Group', style='Group', markers=marker_map)
plt.title("Scatter Plot with Marker Mapping")
plt.show()
Output:
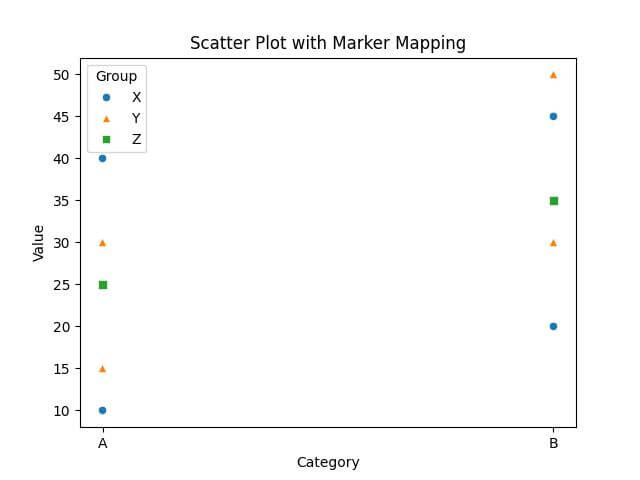
We define a dictionary marker_map that maps the values in the 'Group' column to specific markers (‘o’ for circle, ‘^’ for triangle, and ‘s’ for square).
The markers parameter is used to specify the marker mapping defined.
Mokhtar is the founder of LikeGeeks.com. He is a seasoned technologist and accomplished author, with expertise in Linux system administration and Python development. Since 2010, Mokhtar has built an impressive career, transitioning from system administration to Python development in 2015. His work spans large corporations to freelance clients around the globe. Alongside his technical work, Mokhtar has authored some insightful books in his field. Known for his innovative solutions, meticulous attention to detail, and high-quality work, Mokhtar continually seeks new challenges within the dynamic field of technology.