Customize Annotation Text in Seaborn Heatmap
Annotations are the numbers or text in a heatmap.
In this tutorial, you’ll learn how to adjust font properties, align text, set colors, or even create effects like text shadows and multi-line text in Seaborn heatmap.
Display Annotation
You can set the annot parameter to True to display the annotation.
First, let’s import necessary libraries and prepare some sample data:
import seaborn as sns
import pandas as pd
import numpy as np
import matplotlib.pyplot as plt
np.random.seed(0)
data = np.random.rand(4, 6)
columns = ['A', 'B', 'C', 'D', 'E', 'F']
df = pd.DataFrame(data, columns=columns)
print(df)
Output:
     A         B         C         D         E         F
0  0.548814  0.715189  0.602763  0.544883  0.423655  0.645894
1  0.437587  0.891773  0.963663  0.383442  0.791725  0.528895
2  0.568045  0.925597  0.071036  0.087129  0.020218  0.832620
3  0.778157  0.870012  0.978618  0.799159  0.461479  0.780529
This output shows the randomly generated data in a 4×6 matrix format, ready for visualization.
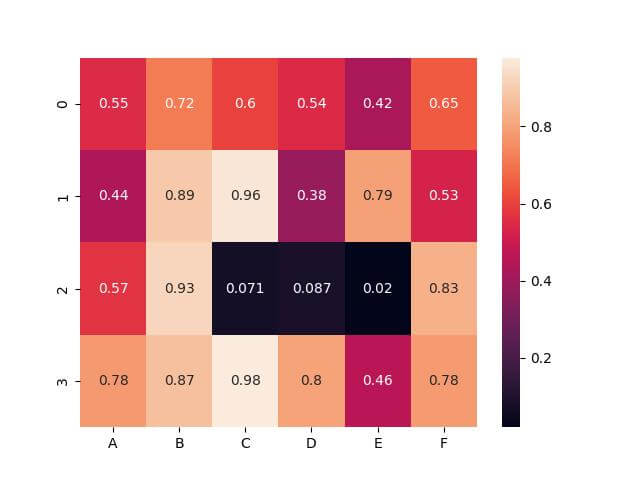
Next, let’s create a heatmap with annotations:
sns.heatmap(df, annot=True)
plt.show()
Output:
Adjust Font Size
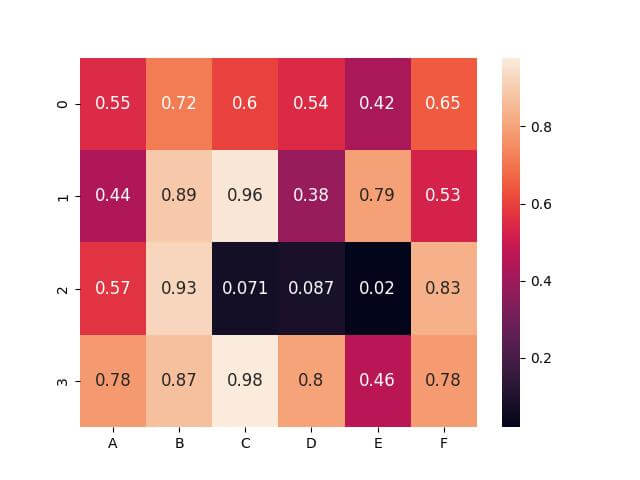
You can use the annot_kws argument with the fontsize parameter to adjust the font size:
sns.heatmap(df, annot=True, annot_kws={"size": 12})
plt.show()
Output:
Set the Color
You can use the color parameter within annot_kws to change the annotation color:
sns.heatmap(df, annot=True, annot_kws={"size": 12, "color": "blue"})
plt.show()
Output:

Set Font Weight & Font Family
Seaborn allows you to set these attributes easily. Let’s explore how to change the font weight and font family for the annotations in our heatmap.
sns.heatmap(df, annot=True, annot_kws={"size": 12, "color": "blue", "weight": "bold", "family": "serif"})
plt.show()
Output:

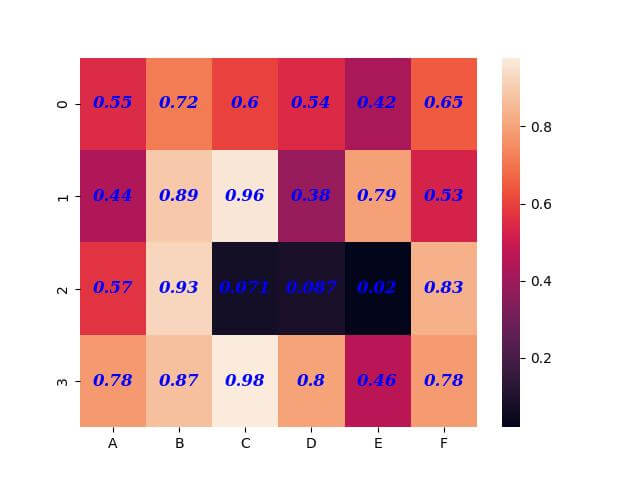
Set Font Style
The font style of annotations in a Seaborn heatmap can be adjusted to ‘normal’, ‘italic’, or ‘oblique’, offering further customization options for your data visualization needs.
sns.heatmap(df, annot=True, annot_kws={"size": 12, "color": "blue", "weight": "bold", "family": "serif", "style": "italic"})
plt.show()
Output:

Alternatively, you can try ‘normal’ or ‘oblique’ styles depending on your preference or the requirements of your data presentation.
Set the Alignment
You can align the text to be ‘center’, ‘left’, or ‘right’, depending on your visualization goals.
sns.heatmap(df, annot=True, annot_kws={"size": 12, "color": "blue", "weight": "bold", "family": "serif", "style": "italic", "ha": "center"})
plt.show()
Output:
Set Background Color
You can use the bbox attribute within annot_kws to set the background color of annotation text:
sns.heatmap(df, annot=True, annot_kws={"size": 12, "color": "blue", "weight": "bold", "family": "serif", "style": "italic", "ha": "center", "bbox": {"facecolor": "yellow", "edgecolor": "black", "boxstyle": "round,pad=0.5"}})
plt.show()
Output:
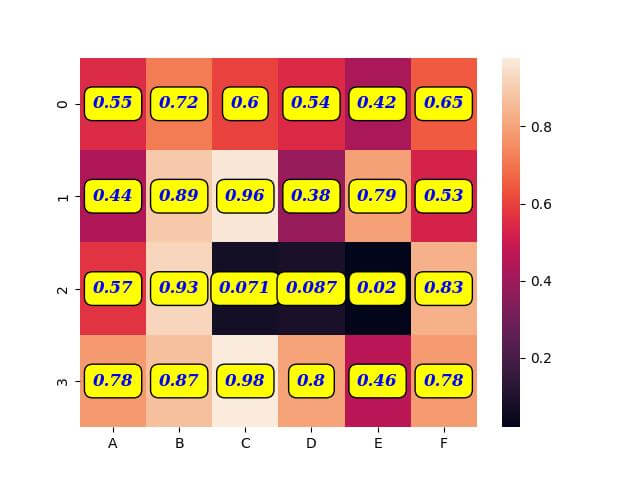
In the above output, the background color of each annotation is set to yellow, with black edge color and rounded corners.
Rotate Annotation Text
You can use the va and rotation parameters within annot_kws to rotate the annotation text:
sns.heatmap(df, annot=True, annot_kws={"size": 12, "color": "white", "weight": "bold", "family": "serif", "style": "italic", "ha": "center", "va": "center", "rotation": 45, "bbox": {"boxstyle": "round,pad=0.5", "edgecolor": "green", "facecolor": "gray"}})
plt.show()
Output:
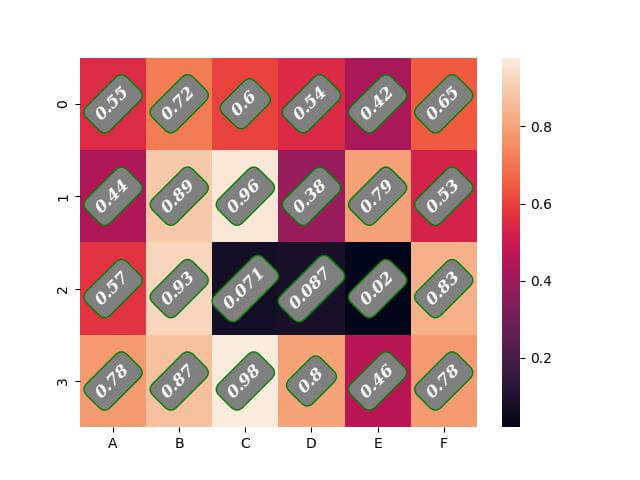
In this example, the annotations are rotated 45 degrees, making them easier to read in a more confined space.
Apply Text Shadows
Seaborn does not provide a direct way to add text shadows, but we can do this effect by overlaying annotations with a slight offset.
You can use matplotlib to apply text shadows to annotation text:
plt.figure(figsize=(8, 6))
ax = sns.heatmap(df, annot=False)  # Base heatmap without annotations

# Adding annotations with 'shadow'
for y in range(df.shape[0]):
    for x in range(df.shape[1]):
        plt.text(x + 0.5, y + 0.5, f'{df.iloc[y, x]:.2f}',
                 horizontalalignment='center',
                 verticalalignment='center',
                 fontsize=12,
                 color='grey',
                 weight='bold',
                 rotation=45)
sns.heatmap(df, annot=True, annot_kws={"size": 12, "weight": "bold", "color": "white", "rotation": 45}, cbar=False, ax=ax)
Output:
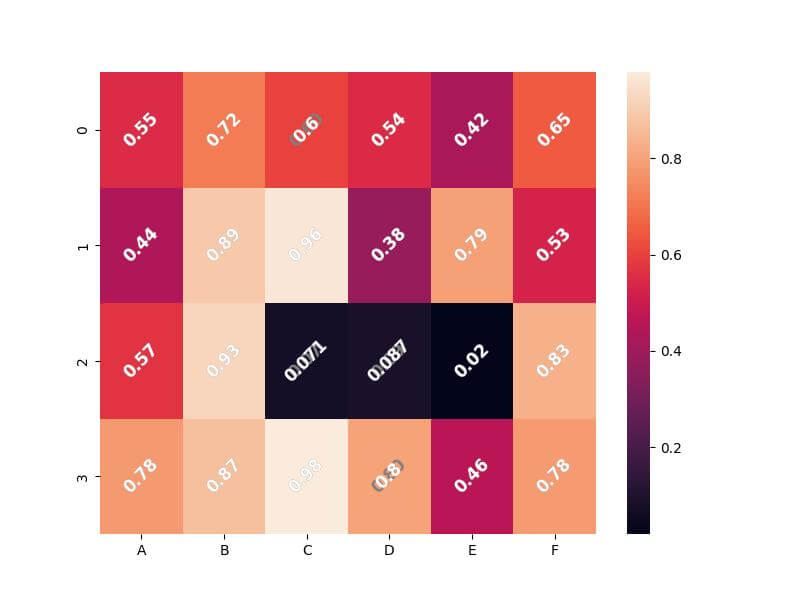
In this output, the ‘shadow’ is created by first placing grey text at each cell’s center and then overlaying the actual white annotation on top of it.
Text Wrapping (Multi-line Text)
While Seaborn does not directly support multi-line text in annotations, we can implement a workaround by manually splitting the text into multiple lines.
Here’s a method to wrap text into multiple lines:
def wrap_text(text, line_width):
    """ Function to split text into multiple lines based on specified width """
    words = text.split()
    wrapped_text = ''
    current_line = ''
    for word in words:
        if len(current_line + ' ' + word) <= line_width:
            current_line += ' ' + word
        else:
            wrapped_text += current_line.strip() + '\n'
            current_line = word
    wrapped_text += current_line.strip()
    return wrapped_text

# Creating heatmap with multi-line annotations
plt.figure(figsize=(10, 8))
ax = sns.heatmap(df, annot=False)  # Base heatmap without annotations

# Adding wrapped text annotations
for y in range(df.shape[0]):
    for x in range(df.shape[1]):
        text_to_wrap = f"Value: {df.iloc[y, x]:.2f}"
        wrapped_text = wrap_text(text_to_wrap, 10)
        plt.text(x + 0.5, y + 0.5, wrapped_text,
                 horizontalalignment='center',
                 verticalalignment='center',
                 fontsize=10,
                 color="white",
                 weight="bold",
                 rotation=0)
plt.show()
Output:
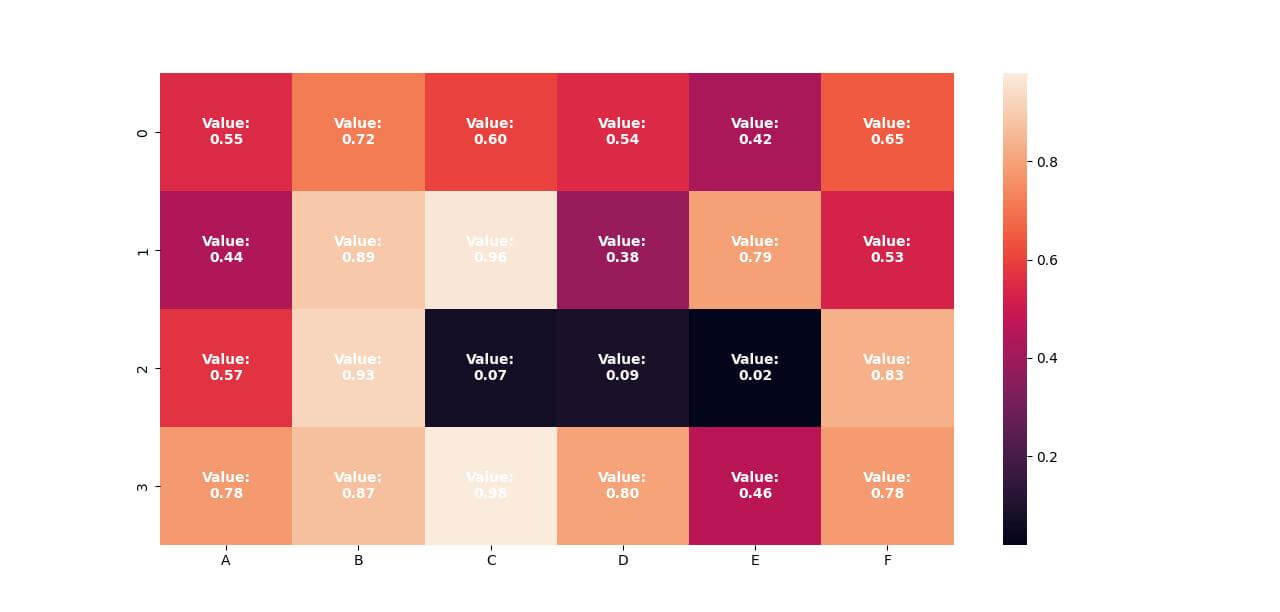
In this example, the wrap_text function splits the annotation text into multiple lines, ensuring that each line does not exceed a specified width.
Mokhtar is the founder of LikeGeeks.com. He is a seasoned technologist and accomplished author, with expertise in Linux system administration and Python development. Since 2010, Mokhtar has built an impressive career, transitioning from system administration to Python development in 2015. His work spans large corporations to freelance clients around the globe. Alongside his technical work, Mokhtar has authored some insightful books in his field. Known for his innovative solutions, meticulous attention to detail, and high-quality work, Mokhtar continually seeks new challenges within the dynamic field of technology.