Apply Masks To Seaborn Heatmap in Python
Masks in Seaborn heatmaps are used to highlight or hide certain parts of your data.
You can apply masks if you want to focus on specific data points, compare certain segments, or simplify your visualizations.
In this tutorial, you’ll learn various techniques for applying masks to Seaborn heatmaps.
From basic upper and lower triangle masks to row/column-specific and threshold-based masks.
Applying Upper Triangle Mask
First, let’s import the necessary libraries and create some sample data:
import seaborn as sns
import numpy as np
import matplotlib.pyplot as plt
np.random.seed(0)
data = np.random.rand(10, 10)
This code generates a 10×10 matrix of random numbers.
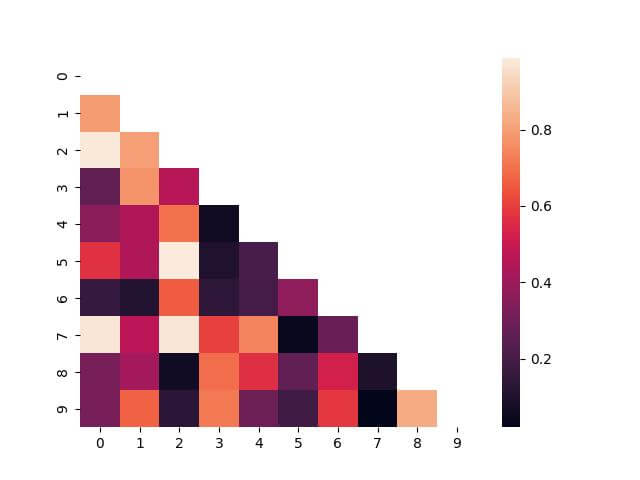
Now, let’s create an upper triangle mask:
mask = np.triu(np.ones_like(data, dtype=bool))
sns.heatmap(data, mask=mask)
plt.show()
Output:
Here, np.triu is used to create a boolean mask for the upper triangle of the matrix, which is then applied to the heatmap.
Applying Lower Triangle Mask
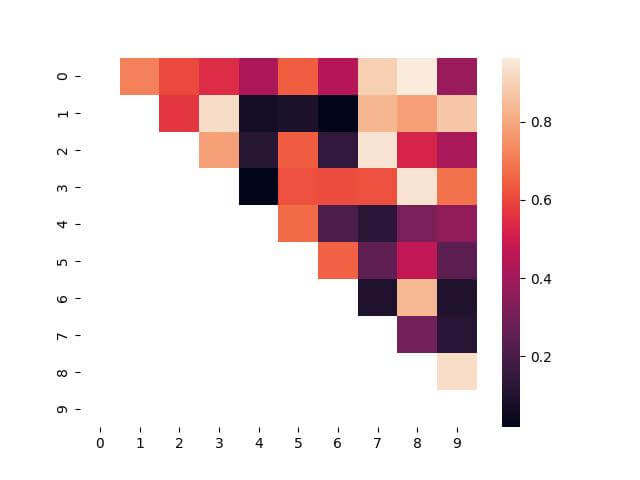
Let’s create a lower triangle mask:
mask = np.tril(np.ones_like(data, dtype=bool))
sns.heatmap(data, mask=mask)
plt.show()
Output:
In this snippet, np.tril is used to generate a boolean mask for the lower triangle of the matrix.
Row or Column Specific Mask
This method is useful when you need to highlight or compare specific sections of your data matrix without the distraction of the remaining data.
mask = np.full_like(data, True, dtype=bool)
mask[2:5, 3:7] = False
sns.heatmap(data, mask=mask)
plt.show()
Output:
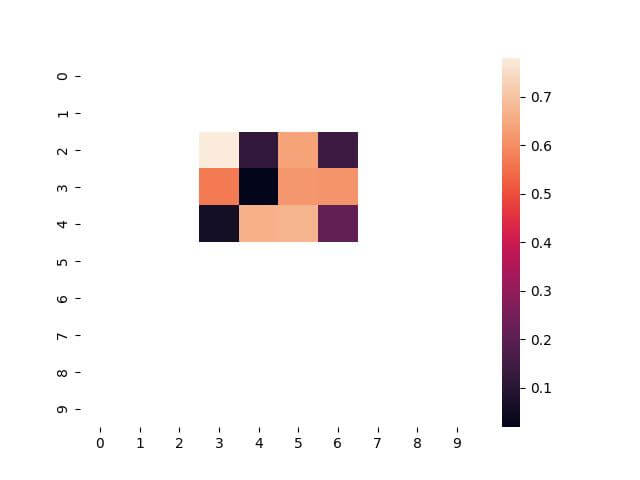
In this code, np.full_like creates a mask filled with True (indicating masked areas), and then specific rows and columns are set to False (unmasked).
The result is a heatmap where only a specified rectangle (rows 2-4 and columns 3-6) is visible, and the rest is masked.
Exclude a column from formatting
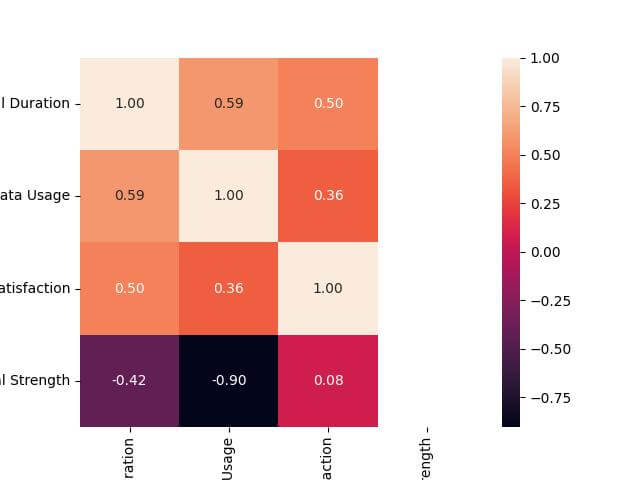
To exclude a column from being formatted, you can manipulate the data parameter or use masking techniques.
You can apply a mask to the specific column to prevent it from being formatted.
import seaborn as sns
import matplotlib.pyplot as plt
import pandas as pd
import numpy as np
data = {
    'Call Duration': [10, 15, 12, 13],
    'Data Usage': [200, 230, 180, 190],
    'Customer Satisfaction': [3, 4, 2, 5],
    'Signal Strength': [80, 70, 85, 90]
}
df = pd.DataFrame(data)
corr_matrix = df.corr()

# Mask to exclude a specific column from formatting
# For instance, to exclude 'Signal Strength', create a mask for this column
mask = np.zeros_like(corr_matrix, dtype=bool)
mask[:, -1] = True  # Adjust the index as per the column to exclude
sns.heatmap(corr_matrix, mask=mask, annot=True, fmt=".2f")
plt.show()
Output:
Threshold Based Mask
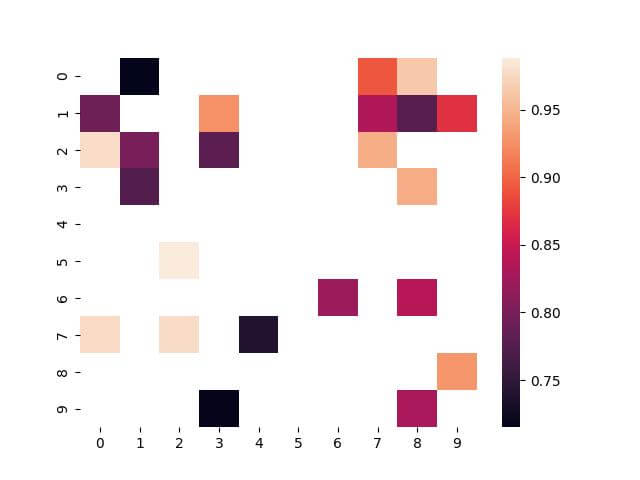
Applying a threshold-based mask to a Seaborn heatmap is a powerful technique for focusing on data points that exceed a specific threshold.
This method is useful when you want to highlight elements that are either above or below a certain value. Let’s walk through how to implement this.
For this example, let’s set a threshold and create a mask based on it:
threshold = 0.7
mask = data < threshold
sns.heatmap(data, mask=mask)
plt.show()
Output:
This code first defines a threshold (0.7 in this case) and then creates a boolean mask where every element in the data that is lower than the threshold is marked True (to be masked).
Custom Mask (Individual Cells)
Creating a custom mask for individual cells in a Seaborn heatmap allows for precise control over which data points are displayed.
This method allows you to highlight or exclude specific data points based on custom criteria.
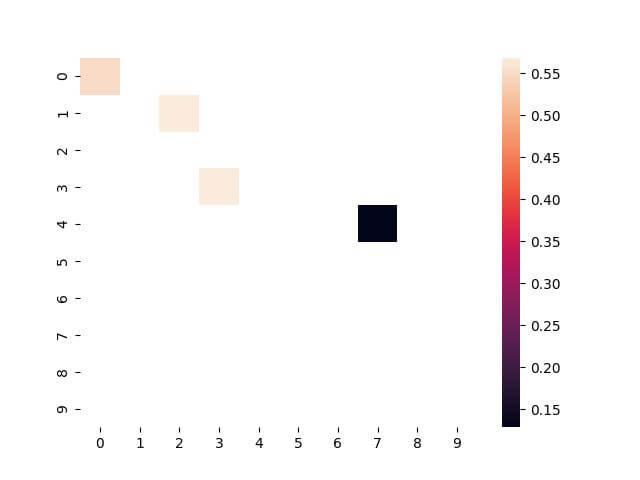
Let’s create a custom mask for individual cells:
mask = np.full_like(data, True, dtype=bool)
selected_cells = [(0, 0), (1, 2), (3, 3), (4, 7)]
for cell in selected_cells:
    mask[cell] = False
sns.heatmap(data, mask=mask)
plt.show()
Output:
In this script, np.full_like is used again to create a full mask. Then, specific cells are unmasked by setting them to False based on the selected_cells list.
Mokhtar is the founder of LikeGeeks.com. He is a seasoned technologist and accomplished author, with expertise in Linux system administration and Python development. Since 2010, Mokhtar has built an impressive career, transitioning from system administration to Python development in 2015. His work spans large corporations to freelance clients around the globe. Alongside his technical work, Mokhtar has authored some insightful books in his field. Known for his innovative solutions, meticulous attention to detail, and high-quality work, Mokhtar continually seeks new challenges within the dynamic field of technology.

