Draw & Customize Lines on Seaborn Heatmap
In this tutorial, we’ll learn how to draw lines and markers on a Seaborn heatmap.
You’ll learn how to draw vertical and horizontal lines, customize their appearance with different colors, styles, and widths, and even add style markers.
Draw Vertical Line
First, ensure you have Seaborn installed:
!pip install seaborn
Next, import the necessary libraries and create a sample dataset:
import seaborn as sns
import numpy as np
import matplotlib.pyplot as plt
data = np.random.rand(10, 12)  # 10 rows and 12 columns
Now, let’s create a basic heatmap:
sns.heatmap(data)
plt.show()
Output:
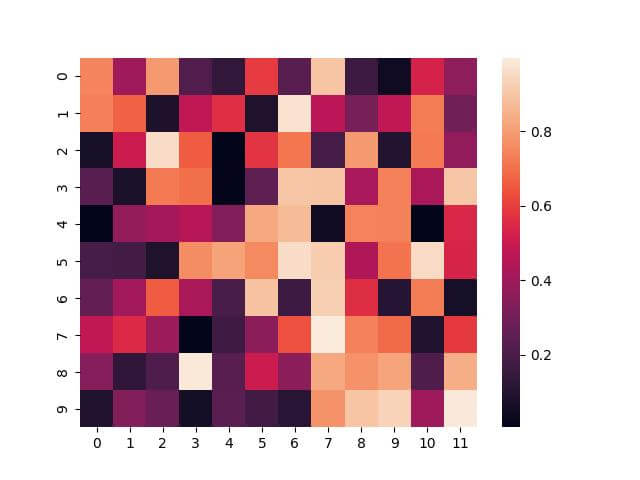
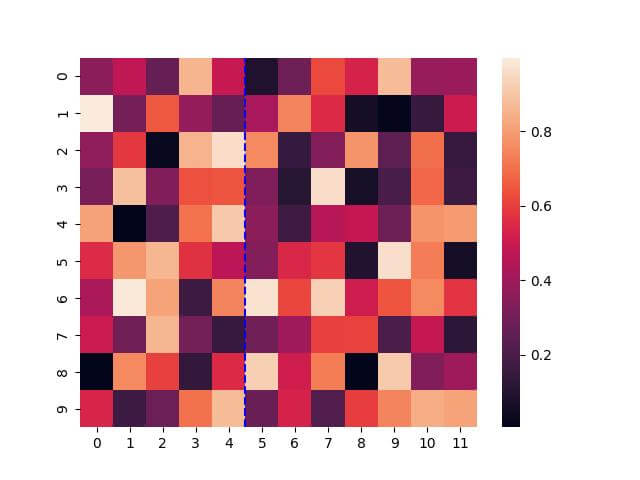
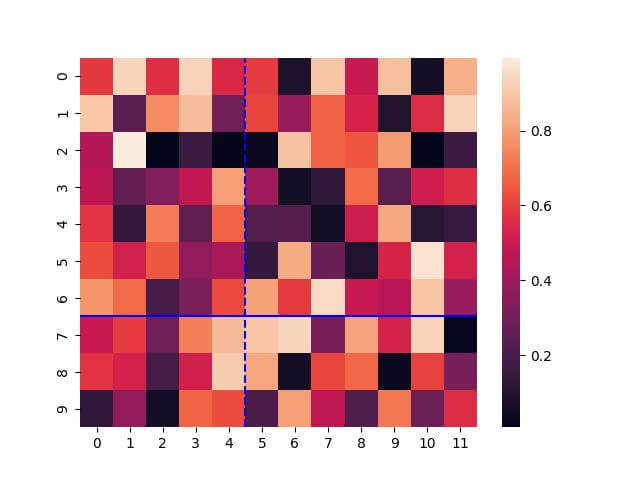
Here, you have a basic heatmap. Next, let’s draw a vertical line at a specific column. Assume we want to highlight the 5th column:
sns.heatmap(data)
plt.axvline(x=5, color='blue', linestyle='--')
plt.show()
Output:
Draw Horizontal Line
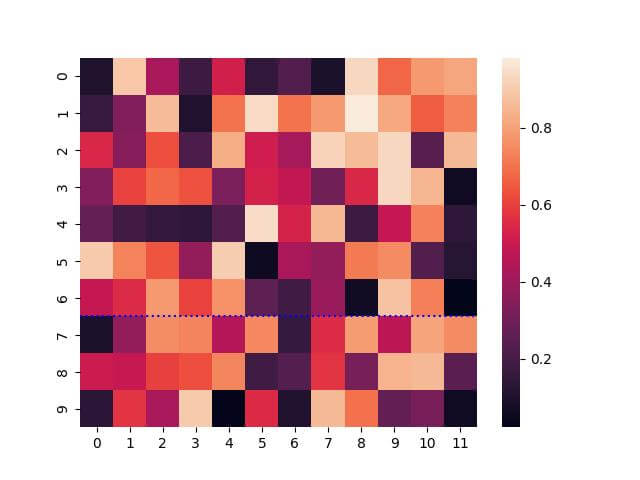
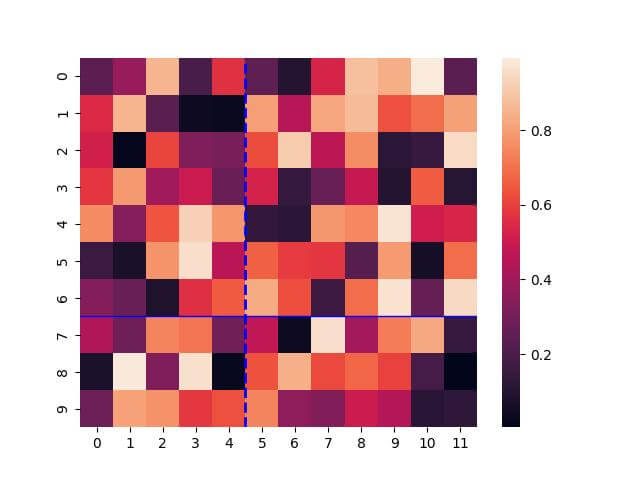
Suppose you want to highlight the 7th row:
# Drawing a horizontal line at the 7th row
sns.heatmap(data)
plt.axhline(y=7, color='blue', linestyle=':')
plt.show()
Output:
Set Line Color
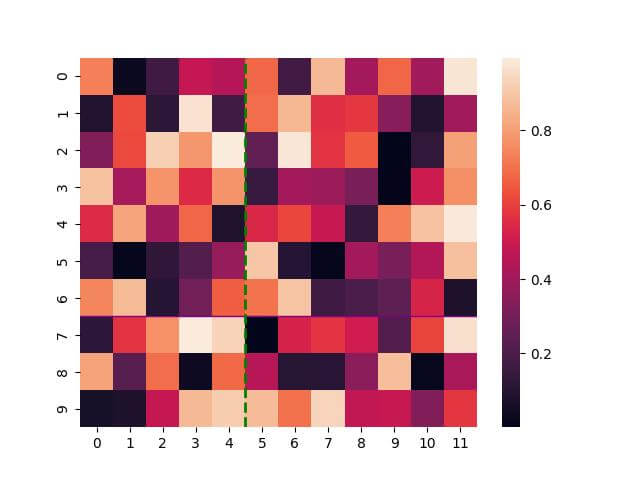
Let’s draw a vertical line and a horizontal line with specific colors:
sns.heatmap(data)
plt.axvline(x=5, color='green', linestyle='--')  # Vertical line in green
plt.axhline(y=7, color='purple', linestyle=':')  # Horizontal line in purple
plt.show()
Output:
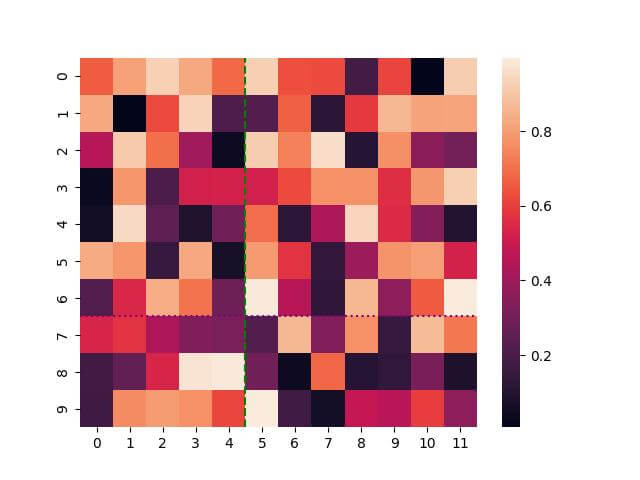
By setting the color parameter in the plt.axvline() and plt.axhline() functions, you can customize the lines to any color.
Set Line Style
You can set the line style by using the linestyle parameter:
sns.heatmap(data)
plt.axvline(x=5, color='blue', linestyle='--')  # Dashed vertical line
plt.axhline(y=7, color='blue', linestyle='-')  # Solid horizontal line
plt.show()
Output:
In this example, the linestyle parameter is used to specify the style of the line. The styles can be solid ('-'), dashed ('--'), dotted (':'), or dash-dot ('-.').
Set Line Width
You can use the linewidth parameter to set different line widths:
sns.heatmap(data)
plt.axvline(x=5, color='blue', linestyle='--', linewidth=2)  # Thicker vertical line
plt.axhline(y=7, color='blue', linestyle='-', linewidth=1)  # Thinner horizontal line
plt.show()
Output:
By modifying the linewidth parameter in the plt.axvline() and plt.axhline() functions, you can easily control the thickness of your lines.
Line Z-Order
You can adjust the Z-order of the lines using the zorder parameter:
sns.heatmap(data)
plt.axvline(x=5, color='green', linestyle='--', linewidth=2, zorder=2)  # Vertical line with higher Z-order
plt.axhline(y=7, color='purple', linestyle='-', linewidth=1, zorder=1)  # Horizontal line with lower Z-order
plt.show()
Output:
In this code, the zorder parameter is used to set the drawing order of the lines.
A higher zorder value means the element is drawn on top of elements with lower values.
This technique is especially useful when dealing with multiple overlapping elements in your heatmap.
Line Marker Size
You can use the marker and markersize parameters within the plt.plot() function to add and size markers on lines.
sns.heatmap(data)
plt.plot([5, 5], [0, 9], color='green', linestyle='--', linewidth=2, marker='o', markersize=10)  # Vertical line with markers
plt.plot([0, 11], [7, 7], color='blue', linestyle='-', linewidth=1, marker='^', markersize=5)  # Horizontal line with markers
plt.show()
Output:
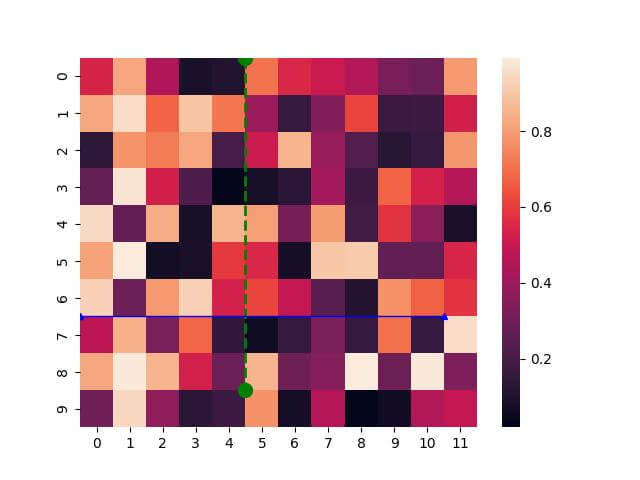
Markers can vary in shape, like circles ('o'), triangles ('^'), or squares ('s'), and their size can be adjusted to suit the visual needs of your heatmap.
Set Marker Color
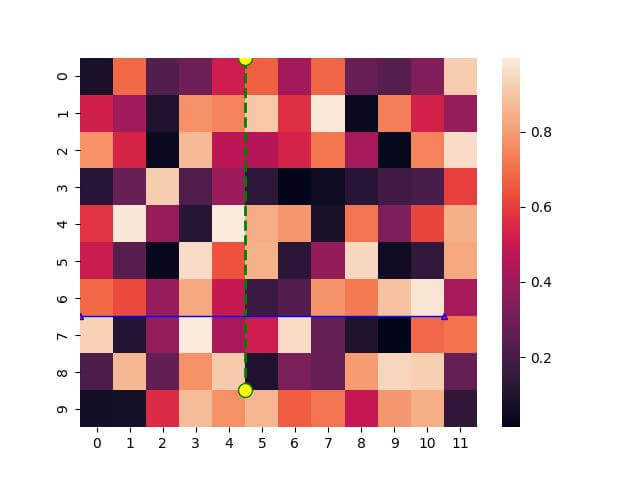
You can use markerfacecolor parameter for setting the color of the markers:
sns.heatmap(data)
plt.plot([5, 5], [0, 9], color='green', linestyle='--', linewidth=2, marker='o', markersize=10, markerfacecolor='yellow')  # Vertical line with yellow markers
plt.plot([0, 11], [7, 7], color='blue', linestyle='-', linewidth=1, marker='^', markersize=5, markerfacecolor='red')  # Horizontal line with red markers
plt.show()
Output:
Set Marker Edge Width
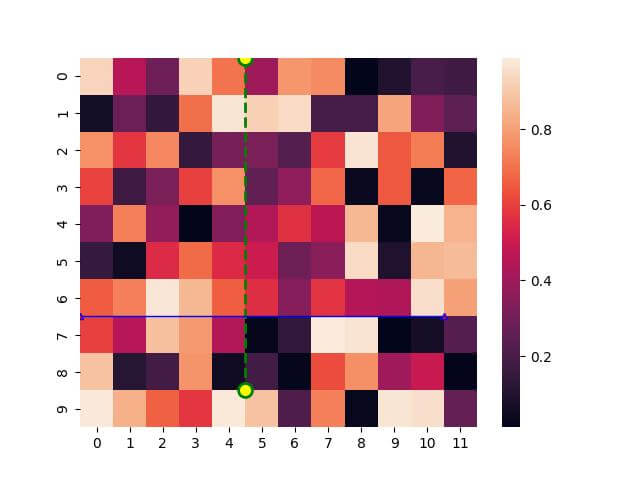
You can use markeredgewidth parameter to control the thickness of the marker’s edge:
sns.heatmap(data)
plt.plot([5, 5], [0, 9], color='green', linestyle='--', linewidth=2, marker='o', markersize=10, markerfacecolor='yellow', markeredgewidth=2)  # Vertical line with thicker edge markers
plt.plot([0, 11], [7, 7], color='purple', linestyle='-', linewidth=1, marker='^', markersize=5, markerfacecolor='red', markeredgewidth=1)  # Horizontal line with thinner edge markers
plt.show()
Output:
Mokhtar is the founder of LikeGeeks.com. He is a seasoned technologist and accomplished author, with expertise in Linux system administration and Python development. Since 2010, Mokhtar has built an impressive career, transitioning from system administration to Python development in 2015. His work spans large corporations to freelance clients around the globe. Alongside his technical work, Mokhtar has authored some insightful books in his field. Known for his innovative solutions, meticulous attention to detail, and high-quality work, Mokhtar continually seeks new challenges within the dynamic field of technology.