Filter Colors Using NumPy in Python
Color filtering is an essential aspect of image processing, it involves isolating specific colors or color ranges in images, allowing for a range of applications from simple photo enhancements to object detection and real-time video analysis.
In this tutorial, you’ll learn how to filter colors using NumPy in Python.
Understanding Image Color Models
In this section, we’ll dive into the RGB color model, grayscale conversion, and HSV/HSL color models, highlighting their significance in color filtering.
The RGB Color Model
The RGB color model represents images using the colors Red, Green, and Blue.
We can create a simple RGB color using NumPy:
import numpy as np
red_color = np.array([255, 0, 0])
print(red_color)
Output:
[255 0 0]
This output shows an array representing the color red in the RGB model, with maximum red (255) and no green or blue.
Grayscale Conversion
Converting an image to grayscale simplifies it by reducing the color information, which is useful for certain processing tasks. Here’s how you convert an RGB color to grayscale:
# Convert the red color to grayscale
gray_scale_value = np.dot(red_color, [0.2989, 0.5870, 0.1140])
print(gray_scale_value)
Output:
76.2195
The grayscale value is a weighted sum of the RGB components, reflecting the perceived brightness of the color.
HSV/HSL Color Models
HSV (Hue, Saturation, Value) and HSL (Hue, Saturation, Lightness) are alternative representations of the color model.
They are useful in filtering because they separate color information (hue) from lighting (value/lightness).
Here’s how you can create a simple HSV color:
hsv_color = np.array([30, 100, 100]) # Hue: 30, Saturation: 100, Value: 100
print(hsv_color)
Output:
[ 30 100 100]
This represents an HSV color with specific hue, saturation, and value levels.
Isolating Single Color Channels
By focusing on individual Red, Green, or Blue (RGB) channels, you can gain insights into specific aspects of an image.
Here, we’ll explore how to isolate these color channels using NumPy in Python.
Isolating the Red Channel
To isolate the red channel, you’ll extract the red component from each pixel while setting the green and blue components to zero. Here’s how to do it:
import numpy as np

# Sample RGB image represented as a 3x3x3 NumPy array
sample_image = np.array([[[255, 0, 0], [0, 255, 0], [0, 0, 255]],
                         [[0, 255, 255], [255, 0, 255], [255, 255, 0]],
                         [[0, 0, 0], [255, 255, 255], [128, 128, 128]]])
red_channel = sample_image.copy()
red_channel[:,:,[1, 2]] = 0
print(red_channel)
Output:
[[[255   0   0]
  [  0   0   0]
  [  0   0   0]]

 [[  0   0   0]
  [255   0   0]
  [255   0   0]]

 [[  0   0   0]
  [255   0   0]
  [128   0   0]]]
In this output, only the red values are retained, while green and blue are set to zero.
Isolating the Green Channel
Similarly, to isolate the green channel, retain only the green values:
green_channel = sample_image.copy()
green_channel[:,:,[0, 2]] = 0
print(green_channel)
Output:
[[[  0   0   0]
  [  0 255   0]
  [  0   0   0]]

 [[  0 255   0]
  [  0   0   0]
  [  0 255   0]]

 [[  0   0   0]
  [  0 255   0]
  [  0 128   0]]]
Here, only the green components are visible.
Isolating the Blue Channel
For the blue channel:
blue_channel = sample_image.copy()
blue_channel[:,:,[0, 1]] = 0
print(blue_channel)
Output:
[[[  0   0   0]
  [  0   0   0]
  [  0   0 255]]

 [[  0   0 255]
  [  0   0 255]
  [  0   0   0]]

 [[  0   0   0]
  [  0   0 255]
  [  0   0 128]]]
Only blue values are present in this output.
Now, Let’s isolate and display the Red, Green, and Blue channels separately using Matplotlib.
This code will create a randomly generated image and then isolate each color channel for display:
import numpy as np
import matplotlib.pyplot as plt

# Sample image array
image = np.random.rand(100, 100, 3)  # Randomly generated sample image

# Function to isolate a color channel
def isolate_color_channel(image, channel_index):
    # Creating a copy of the image
    filtered_image = image.copy()
    # Setting the other two channels to 0
    zero_indices = [i for i in range(3) if i != channel_index]
    filtered_image[:, :, zero_indices] = 0
    return filtered_image

# Isolating each color channel
red_filtered = isolate_color_channel(image, 0)
green_filtered = isolate_color_channel(image, 1)
blue_filtered = isolate_color_channel(image, 2)
plt.figure(figsize=(15, 5))

# Displaying original image
plt.subplot(1, 4, 1)
plt.imshow(image)
plt.title("Original Image")

# Displaying red channel image
plt.subplot(1, 4, 2)
plt.imshow(red_filtered)
plt.title("Red Color Filtered Image")

# Displaying green channel image
plt.subplot(1, 4, 3)
plt.imshow(green_filtered)
plt.title("Green Color Filtered Image")

# Displaying blue channel image
plt.subplot(1, 4, 4)
plt.imshow(blue_filtered)
plt.title("Blue Color Filtered Image")
plt.show()
Output:
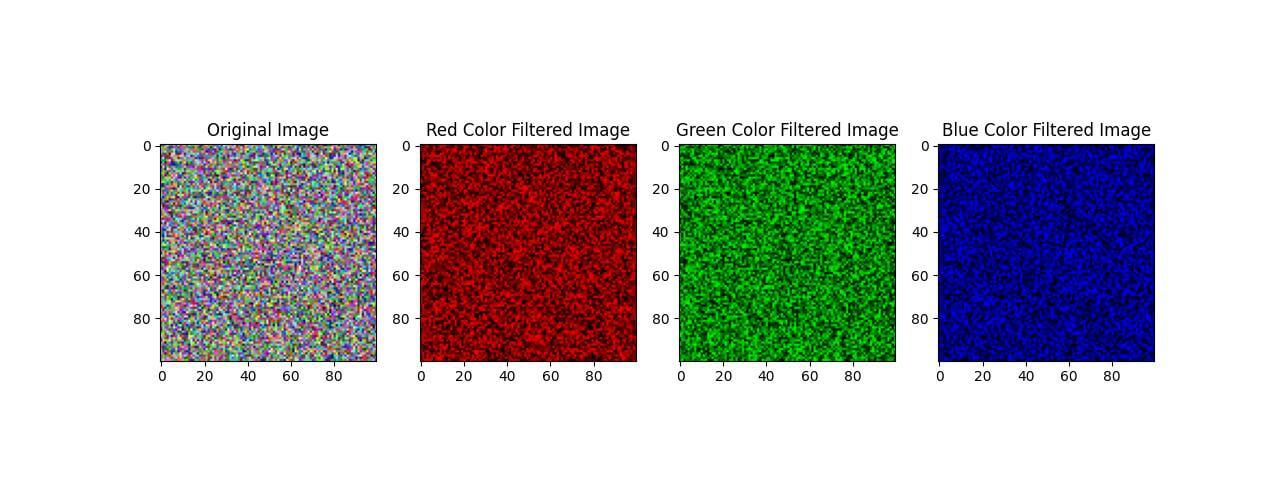
This code creates a sample image and then isolates each of the RGB channels by setting the other two channels to zero in each case using isolate_color_channel function.
Creating Binary Masks Based on Color Thresholds
Creating binary masks based on color thresholds involves setting a threshold value to isolate specific colors or color ranges in an image.
These masks are useful for various applications like object detection, background removal, and more.
Let’s create a threshold to isolate a specific color range.
import numpy as np
import matplotlib.pyplot as plt
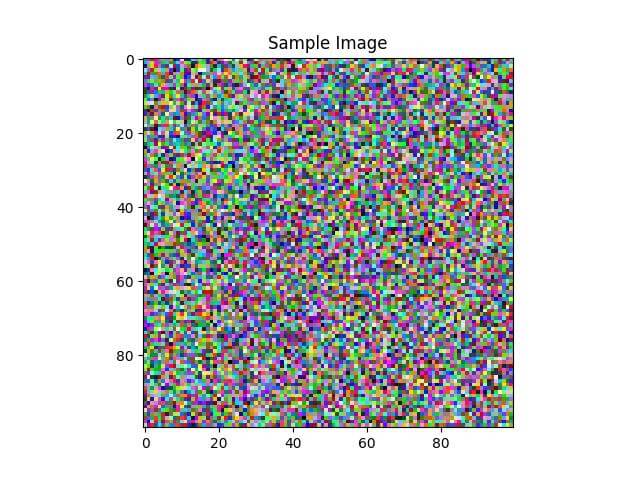
# Generating a random image for demonstration
image = np.random.rand(100, 100, 3)
# Defining color thresholds for red
lower_red = np.array([0.5, 0, 0]) # Lower bound for red
upper_red = np.array([1, 0.2, 0.2]) # Upper bound for red
plt.imshow(image)
plt.title("Sample Image")
plt.show()
Output:
Now, create a binary mask that identifies pixels within the red color range:
# Creating a binary mask
mask = np.all(np.logical_and(lower_red <= image, image <= upper_red), axis=-1)

plt.imshow(mask, cmap='gray')
plt.title("Binary Mask for Red Color Range")
plt.show()
Output:
![]()
This code generates a binary mask where white areas (True) indicate pixels that fall within the defined red color range, and black areas (False) represent other colors.
Finally, apply this mask to the original image to see the result:
masked_image = np.where(mask[..., None], image, 0)
plt.imshow(masked_image)
plt.title("Image After Applying Red Color Mask")
plt.show()
Output:
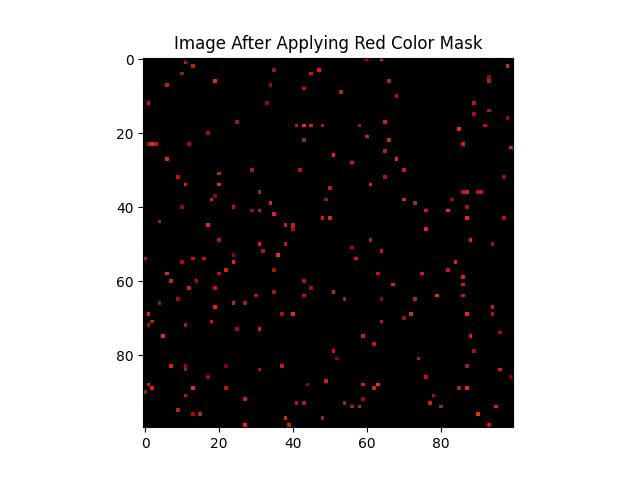
The masked image highlights only the areas that meet the red color criteria, effectively filtering the image based on the color threshold.
Combining and Splitting Color Channels
First, let’s split an image into its individual Red, Green, and Blue (RGB) channels.
import numpy as np
import matplotlib.pyplot as plt

# Generating a random image
image = np.random.rand(100, 100, 3)

# Splitting the color channels
red_channel = image[:, :, 0]
green_channel = image[:, :, 1]
blue_channel = image[:, :, 2]

# Displaying the color channels
plt.figure(figsize=(15, 5))

plt.subplot(1, 3, 1)
plt.imshow(red_channel, cmap='Reds')
plt.title("Red Channel")

plt.subplot(1, 3, 2)
plt.imshow(green_channel, cmap='Greens')
plt.title("Green Channel")

plt.subplot(1, 3, 3)
plt.imshow(blue_channel, cmap='Blues')
plt.title("Blue Channel")
plt.show()
Output:

This code separates the image into its red, green, and blue components, displaying each channel individually.
The cmap parameter in imshow ensures that each channel is visualized in its respective color.
Now, let’s combine different color channels to form a new image. For instance, we can combine the red and green channels to create a yellowish image:
# Combining red and green channels to form yellow
yellow_image = np.stack([red_channel, green_channel, np.zeros_like(blue_channel)], axis=-1)
plt.imshow(yellow_image)
plt.title("Combined Yellow Image (Red + Green)")
plt.show()
Output:
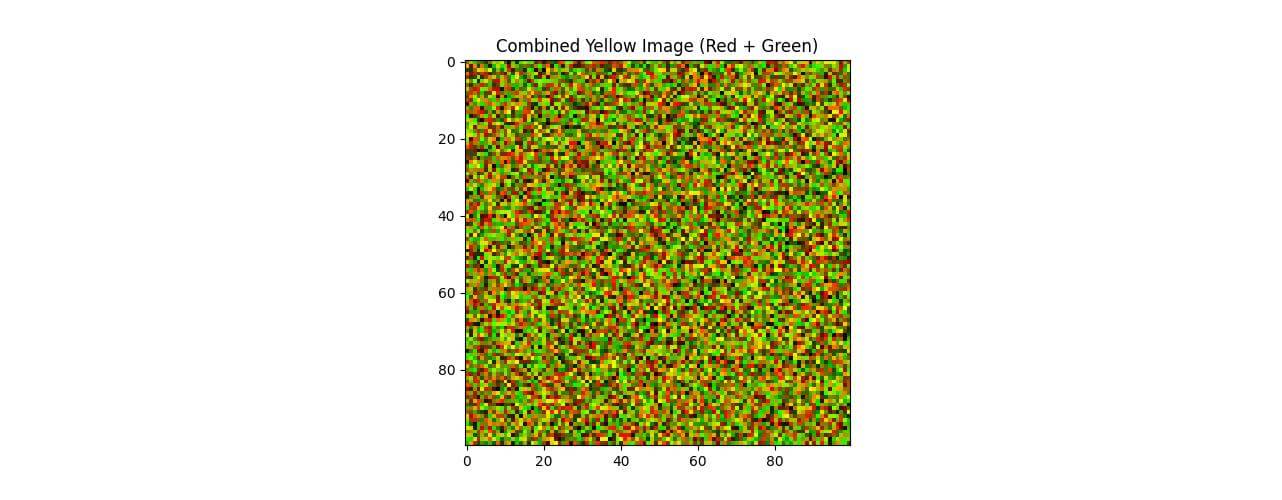
This code combines the red and green channels while setting the blue channel to zero, resulting in a yellow-colored image.
This demonstrates how combining different color channels can create various color effects.
Detecting and Isolating Specific Color Ranges
Detecting and isolating specific color ranges in images allows for the identification and extraction of objects or features based on their color.
It’s useful in applications like object tracking, image segmentation, and automated quality control.
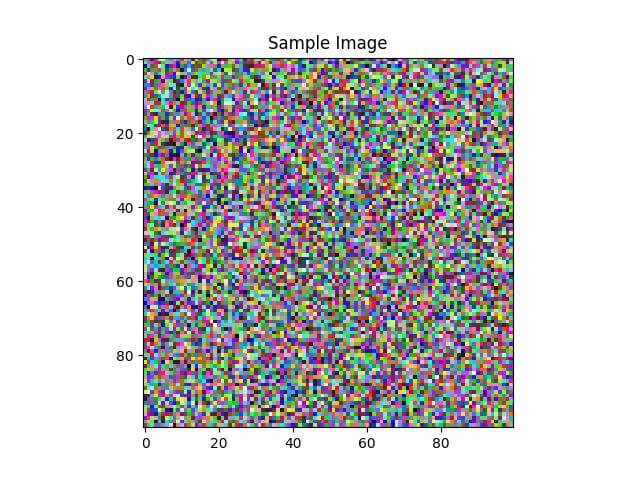
First, define the color range you want to detect. For this example, let’s focus on isolating a specific shade of blue. We start by setting up the color thresholds:
import numpy as np
import matplotlib.pyplot as plt

# Generating a random image
image = np.random.rand(100, 100, 3)

# Defining color thresholds for blue
lower_blue = np.array([0, 0, 0.5])  # Lower bound for blue
upper_blue = np.array([0.3, 0.3, 1])  # Upper bound for blue
plt.imshow(image)
plt.title("Sample Image")
plt.show()
Output:
Next, create a mask that detects the pixels within the specified blue color range:
# Creating a binary mask for the blue color range
blue_mask = np.all(np.logical_and(lower_blue <= image, image <= upper_blue), axis=-1)
plt.imshow(blue_mask, cmap='gray')
plt.title("Binary Mask for Blue Color Range")
plt.show()
Output:
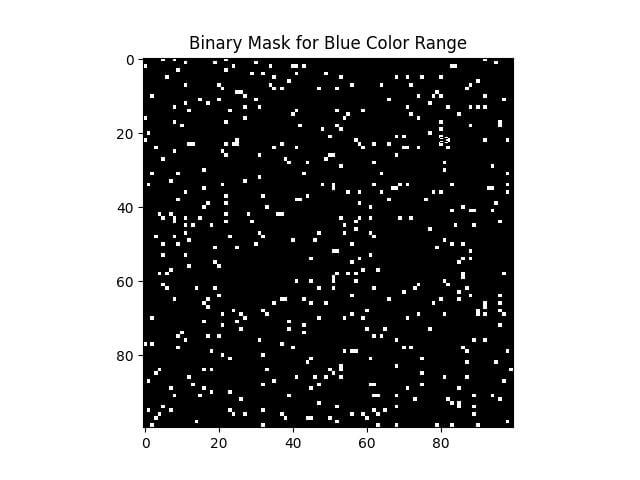
This binary mask shows the areas in the image that fall within the specified blue color range.
Now, apply this mask to the original image to isolate the blue color range:
# Applying the mask to the original image
isolated_blue = np.where(blue_mask[..., None], image, 0)

plt.imshow(isolated_blue)
plt.title("Image After Isolating Blue Color Range")
plt.show()
Output:
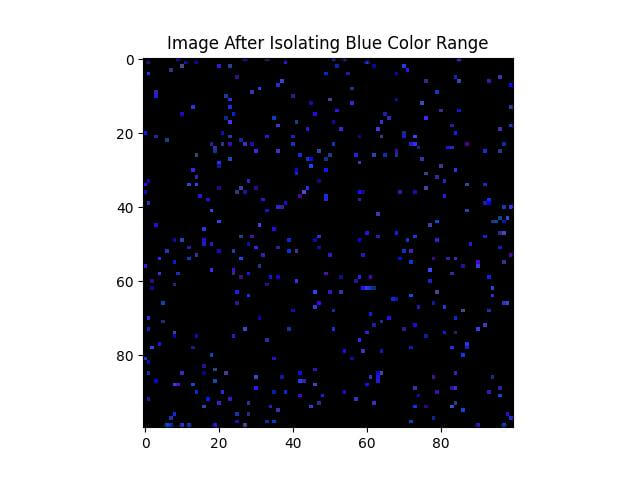
The resulting image highlights the regions that match the defined blue color range. Other areas are set to black, effectively isolating the color of interest.
Dealing with Varying Lighting Conditions
One of the primary challenges in color filtering is the variation in how colors appear under different lighting conditions.
For example, an object that appears red in daylight might look quite different under artificial light.
This variation can significantly affect the accuracy of color-based image processing.
To deal with varying lighting conditions, consider the following strategies:
Dynamic Threshold Adjustments:
Adjust color thresholds dynamically based on the lighting conditions of the image. This can be done through real-time analysis of the image’s overall brightness and contrast.
average_brightness = np.mean(image)
adjusted_lower_blue = lower_blue * average_brightness
adjusted_upper_blue = upper_blue * average_brightness
In this example, the blue color thresholds are adjusted based on the average brightness of the image.
Using HSV/HSL Color Models:
The HSV (Hue, Saturation, Value) and HSL (Hue, Saturation, Lightness) models are less sensitive to lighting variations compared to RGB.
Converting your image to one of these models before applying color filters can improve consistency.
from matplotlib.colors import rgb_to_hsv
hsv_image = rgb_to_hsv(image)
hsv_mask = np.all(np.logical_and(lower_hsv <= hsv_image, hsv_image <= upper_hsv), axis=-1)
This code converts an RGB image to HSV and applies a mask based on HSV thresholds.
Real-Time Color Filtering in Video Streams
Processing a video stream is different from processing a static image. A video is a sequence of images (frames), and real-time processing involves applying color filtering to each frame as it is received.
Essential Steps for Real-Time Color Filtering
Frame Capture:
Continuously capture frames from the video stream. Python libraries like OpenCV are commonly used for this purpose.
import cv2
import numpy as np
video_capture = cv2.VideoCapture(0)
This code initializes video capture from the default webcam.
Applying Color Filters:
Apply the desired color filter to each frame. This involves selecting a color range and creating a mask, similar to image processing.
while True:
    ret, frame = video_capture.read()  # Read a frame
    if not ret:
        break

    # Convert frame to HSV (better for color filtering)
    hsv_frame = cv2.cvtColor(frame, cv2.COLOR_BGR2HSV)

    # Example: Detecting red color
    lower_red = np.array([160, 100, 100])
    upper_red = np.array([180, 255, 255])
    mask = cv2.inRange(hsv_frame, lower_red, upper_red)

    # Apply the mask to the frame
    filtered_frame = cv2.bitwise_and(frame, frame, mask=mask)
    cv2.imshow('Real-Time Color Filtered Stream', filtered_frame)

    # Break the loop with a specific key press ('q')
    if cv2.waitKey(1) & 0xFF == ord('q'):
        break
video_capture.release()
cv2.destroyAllWindows()
This loop continuously reads frames, applies a color filter, and displays the result in real time.
Real-time color filtering in video streams requires a balance between accurate color detection and processing efficiency.
Mokhtar is the founder of LikeGeeks.com. He is a seasoned technologist and accomplished author, with expertise in Linux system administration and Python development. Since 2010, Mokhtar has built an impressive career, transitioning from system administration to Python development in 2015. His work spans large corporations to freelance clients around the globe. Alongside his technical work, Mokhtar has authored some insightful books in his field. Known for his innovative solutions, meticulous attention to detail, and high-quality work, Mokhtar continually seeks new challenges within the dynamic field of technology.