Embed 3D plot inside Tkinter Window in Python
In this tutorial, you’ll learn how to embed a 3D plot created with Matplotlib inside a Tkinter window.
You’ll use Python Matplotlib 3D plotting capabilities along with the Tkinter library to build a data visualization tool.
Embed Matplotlib Figure in Tkinter
To embed the Matplotlib figure in the Tkinter window, you can use FigureCanvasTkAgg:
import tkinter as tk
from matplotlib.backends.backend_tkagg import FigureCanvasTkAgg
import matplotlib.pyplot as plt
from mpl_toolkits.mplot3d import Axes3D
import numpy as np
root = tk.Tk()
root.title("3D Plot in Tkinter")
root.geometry("800x600")
fig = plt.figure(figsize=(6, 4), dpi=100)
ax = fig.add_subplot(111, projection='3d')
x = np.linspace(-5, 5, 100)
y = np.linspace(-5, 5, 100)
X, Y = np.meshgrid(x, y)
Z = np.sin(np.sqrt(X**2 + Y**2))
surf = ax.plot_surface(X, Y, Z, cmap='viridis')
canvas = FigureCanvasTkAgg(fig, master=root)
canvas_widget = canvas.get_tk_widget()
canvas_widget.pack(fill=tk.BOTH, expand=True)
root.mainloop()
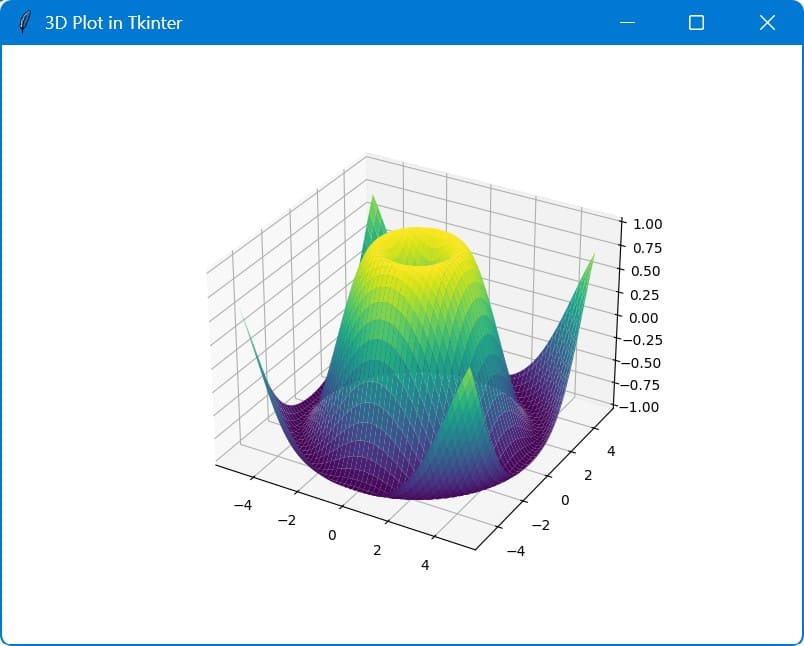
Output:
The canvas is then packed to fill the entire window.
To add a navigation toolbar, you can use NavigationToolbar2Tk:
import tkinter as tk
from matplotlib.backends.backend_tkagg import FigureCanvasTkAgg, NavigationToolbar2Tk
import matplotlib.pyplot as plt
from mpl_toolkits.mplot3d import Axes3D
import numpy as np
root = tk.Tk()
root.title("3D Plot in Tkinter")
root.geometry("800x600")
fig = plt.figure(figsize=(6, 4), dpi=100)
ax = fig.add_subplot(111, projection='3d')
x = np.linspace(-5, 5, 100)
y = np.linspace(-5, 5, 100)
X, Y = np.meshgrid(x, y)
Z = np.sin(np.sqrt(X**2 + Y**2))
surf = ax.plot_surface(X, Y, Z, cmap='viridis')
canvas = FigureCanvasTkAgg(fig, master=root)
canvas_widget = canvas.get_tk_widget()
canvas_widget.pack(fill=tk.BOTH, expand=True)
toolbar = NavigationToolbar2Tk(canvas, root)
toolbar.update()
canvas_widget.pack(fill=tk.BOTH, expand=True)
root.mainloop()
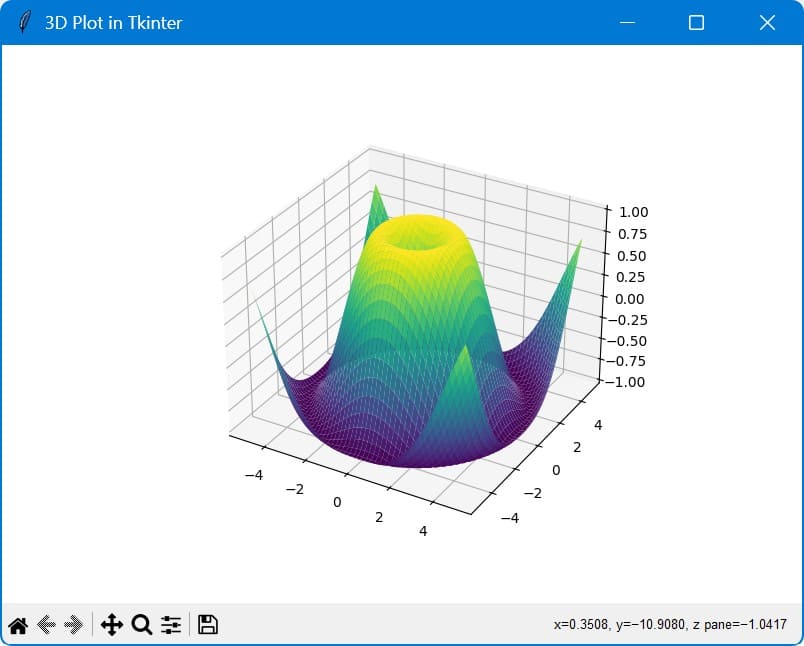
Output:
This code adds a navigation toolbar below the canvas so you can use standard Matplotlib navigation tools like zoom, pan, and save.
Implement Plot Update
To update the plot dynamically, you can create a function that modifies the plot data and redraws the canvas:
import tkinter as tk
from matplotlib.backends.backend_tkagg import FigureCanvasTkAgg, NavigationToolbar2Tk
import matplotlib.pyplot as plt
from mpl_toolkits.mplot3d import Axes3D
import numpy as np
root = tk.Tk()
root.title("3D Plot in Tkinter")
root.geometry("800x600")
fig = plt.figure(figsize=(6, 4), dpi=100)
ax = fig.add_subplot(111, projection='3d')
x = np.linspace(-5, 5, 100)
y = np.linspace(-5, 5, 100)
X, Y = np.meshgrid(x, y)
Z = np.sin(np.sqrt(X**2 + Y**2))
surf = ax.plot_surface(X, Y, Z, cmap='viridis')
canvas = FigureCanvasTkAgg(fig, master=root)
canvas_widget = canvas.get_tk_widget()
canvas_widget.pack(fill=tk.BOTH, expand=True)
toolbar = NavigationToolbar2Tk(canvas, root)
toolbar.update()
canvas_widget.pack(fill=tk.BOTH, expand=True)
def update_plot():
    global Z
    Z = np.sin(np.sqrt(X**2 + Y**2) + np.random.rand())
    ax.clear()
    ax.plot_surface(X, Y, Z, cmap='viridis')
    canvas.draw()
update_button = tk.Button(root, text="Update Plot", command=update_plot)
update_button.pack()
root.mainloop()
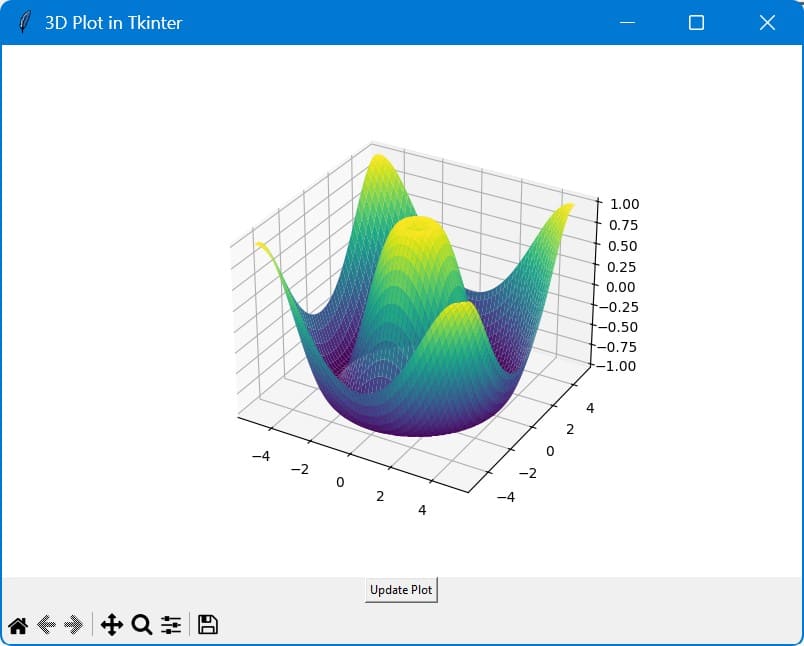
Output:
This code adds an “Update Plot” button that, when clicked, updates the Z values with a random offset and redraws the plot.
Add Additional Tkinter Widgets
You can add sliders to control plot parameters dynamically:
import tkinter as tk
from tkinter import ttk
from matplotlib.backends.backend_tkagg import FigureCanvasTkAgg, NavigationToolbar2Tk
import matplotlib.pyplot as plt
from mpl_toolkits.mplot3d import Axes3D
import numpy as np
root = tk.Tk()
root.title("3D Plot in Tkinter")
root.geometry("800x600")
fig = plt.figure(figsize=(6, 4), dpi=100)
ax = fig.add_subplot(111, projection='3d')
x = np.linspace(-5, 5, 100)
y = np.linspace(-5, 5, 100)
X, Y = np.meshgrid(x, y)
Z = np.sin(np.sqrt(X**2 + Y**2))
surf = ax.plot_surface(X, Y, Z, cmap='viridis')
canvas = FigureCanvasTkAgg(fig, master=root)
canvas_widget = canvas.get_tk_widget()
canvas_widget.pack(fill=tk.BOTH, expand=True)
toolbar = NavigationToolbar2Tk(canvas, root)
toolbar.update()
canvas_widget.pack(fill=tk.BOTH, expand=True)
def update_plot(frequency):
    global Z
    Z = np.sin(frequency * np.sqrt(X**2 + Y**2))
    ax.clear()
    ax.plot_surface(X, Y, Z, cmap='viridis')
    canvas.draw()
frequency_slider = ttk.Scale(root, from_=0.1, to=2, orient=tk.HORIZONTAL, command=lambda x: update_plot(float(x)))
frequency_slider.set(1)
frequency_slider.pack()
root.mainloop()
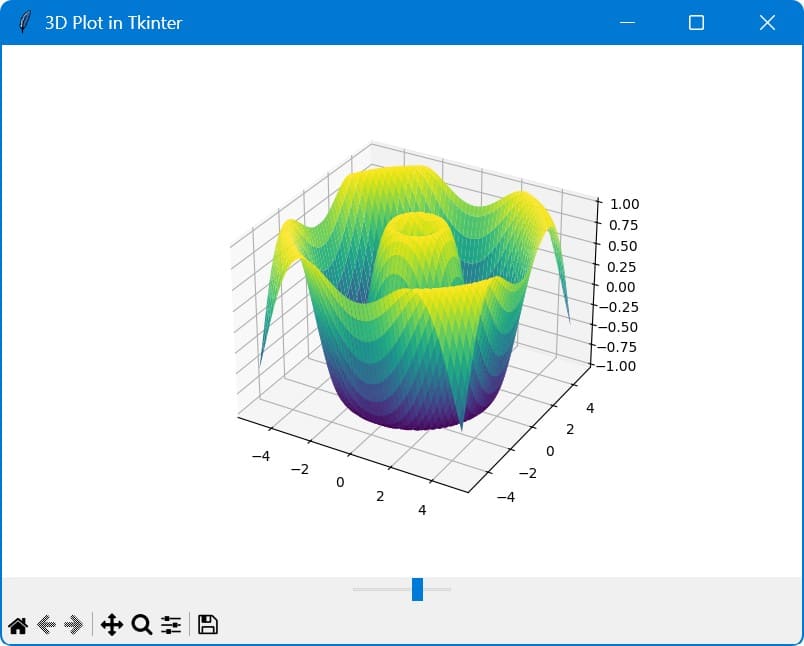
Output:
The slider controls the frequency of the sinusoidal function so you can modify the plot.
Zooming and Rotation
Matplotlib 3D plots already support zooming and rotation using the mouse.
However, you can add custom controls for finer adjustments:
import tkinter as tk
from tkinter import ttk
from matplotlib.backends.backend_tkagg import FigureCanvasTkAgg, NavigationToolbar2Tk
import matplotlib.pyplot as plt
from mpl_toolkits.mplot3d import Axes3D
import numpy as np
root = tk.Tk()
root.title("3D Plot in Tkinter")
root.geometry("800x600")
fig = plt.figure(figsize=(6, 4), dpi=100)
ax = fig.add_subplot(111, projection='3d')
x = np.linspace(-5, 5, 100)
y = np.linspace(-5, 5, 100)
X, Y = np.meshgrid(x, y)
Z = np.sin(np.sqrt(X**2 + Y**2))
surf = ax.plot_surface(X, Y, Z, cmap='viridis')
canvas = FigureCanvasTkAgg(fig, master=root)
canvas_widget = canvas.get_tk_widget()
canvas_widget.pack(fill=tk.BOTH, expand=True)
toolbar = NavigationToolbar2Tk(canvas, root)
toolbar.update()
canvas_widget.pack(fill=tk.BOTH, expand=True)
def update_view(elev, azim):
  ax.view_init(elev=elev, azim=azim)
  canvas.draw()
elev_slider = ttk.Scale(root, from_=0, to=90, orient=tk.HORIZONTAL)
elev_slider.set(30)
elev_slider.pack()
azim_slider = ttk.Scale(root, from_=0, to=360, orient=tk.HORIZONTAL)
azim_slider.set(45)
azim_slider.pack()
elev_slider.config(command=lambda x: update_view(float(x), azim_slider.get()))
azim_slider.config(command=lambda x: update_view(elev_slider.get(), float(x)))
root.mainloop()
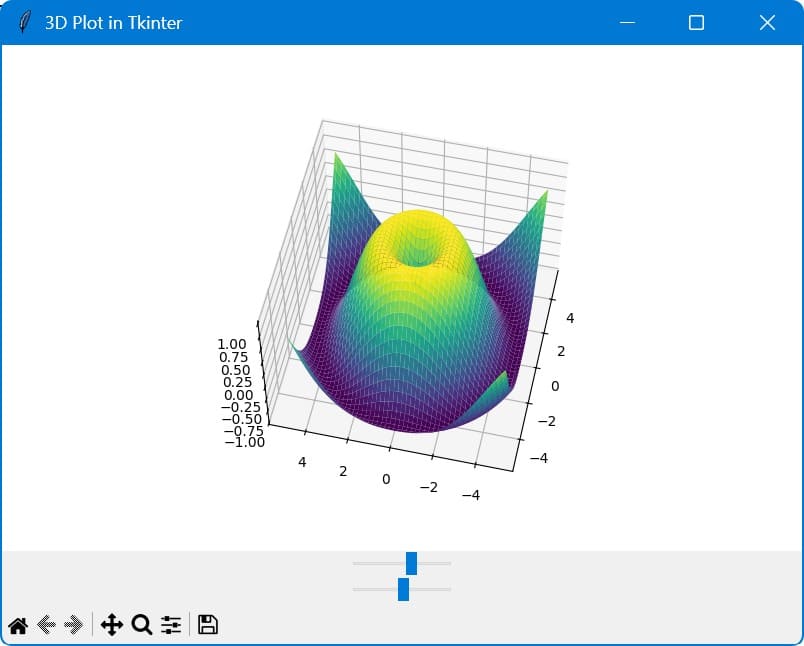
Output:
This code adds two sliders to control the elevation and azimuth angles of the 3D plot.
Integrate with Data Sources for Real-time Plotting
You can integrate real-time data sources to update the plot continuously:
import tkinter as tk
from matplotlib.backends.backend_tkagg import FigureCanvasTkAgg, NavigationToolbar2Tk
import matplotlib.pyplot as plt
from mpl_toolkits.mplot3d import Axes3D
import numpy as np
root = tk.Tk()
root.title("Real-time 3D Plot in Tkinter")
root.geometry("800x600")
fig = plt.figure(figsize=(6, 4), dpi=100)
ax = fig.add_subplot(111, projection='3d')
x = np.linspace(-5, 5, 50)
y = np.linspace(-5, 5, 50)
X, Y = np.meshgrid(x, y)
Z = np.zeros_like(X)
surf = ax.plot_surface(X, Y, Z, cmap='viridis')
canvas = FigureCanvasTkAgg(fig, master=root)
canvas_widget = canvas.get_tk_widget()
canvas_widget.pack(fill=tk.BOTH, expand=True)
toolbar = NavigationToolbar2Tk(canvas, root)
toolbar.update()
canvas_widget.pack(fill=tk.BOTH, expand=True)
def update_plot():
    global Z
    Z = np.sin(np.sqrt(X**2 + Y**2) + np.random.rand())
    ax.clear()
    ax.plot_surface(X, Y, Z, cmap='viridis')
    canvas.draw()
    root.after(100, update_plot)  # Schedule the next update
update_plot()  # Start the update loop
root.mainloop()
This code simulates real-time data by updating the plot every 100 milliseconds with new random data.
Save and Load Plots
You can add functionality to save and load plot data:
import tkinter as tk
from tkinter import filedialog
from matplotlib.backends.backend_tkagg import FigureCanvasTkAgg, NavigationToolbar2Tk
import matplotlib.pyplot as plt
from mpl_toolkits.mplot3d import Axes3D
import numpy as np
import pickle
root = tk.Tk()
root.title("3D Plot in Tkinter with Save/Load")
root.geometry("800x600")
fig = plt.figure(figsize=(6, 4), dpi=100)
ax = fig.add_subplot(111, projection='3d')
x = np.linspace(-5, 5, 50)
y = np.linspace(-5, 5, 50)
X, Y = np.meshgrid(x, y)
Z = np.sin(np.sqrt(X**2 + Y**2))
surf = ax.plot_surface(X, Y, Z, cmap='viridis')
canvas = FigureCanvasTkAgg(fig, master=root)
canvas_widget = canvas.get_tk_widget()
canvas_widget.pack(fill=tk.BOTH, expand=True)
toolbar = NavigationToolbar2Tk(canvas, root)
toolbar.update()
canvas_widget.pack(fill=tk.BOTH, expand=True)

def save_plot():
  file_path = filedialog.asksaveasfilename(defaultextension=".pkl", filetypes=[("Pickle files", "*.pkl")])
  if file_path:
      # Retrieve current elevation and azimuth angles
      elev = ax.elev
      azim = ax.azim
      # Save Z data and angles in a dictionary
      plot_data = {'Z': Z, 'elev': elev, 'azim': azim}
      with open(file_path, 'wb') as file:
          pickle.dump(plot_data, file)

def load_plot():
  file_path = filedialog.askopenfilename(filetypes=[("Pickle files", "*.pkl")])
  if file_path:
      with open(file_path, 'rb') as file:
          plot_data = pickle.load(file)
          global Z
          Z = plot_data['Z']
          elev = plot_data['elev']
          azim = plot_data['azim']
          ax.clear()
          ax.plot_surface(X, Y, Z, cmap='viridis')
          # Restore the elevation and azimuth angles
          ax.view_init(elev=elev, azim=azim)
          canvas.draw()
save_button = tk.Button(root, text="Save Plot", command=save_plot)
save_button.pack(side=tk.LEFT)
load_button = tk.Button(root, text="Load Plot", command=load_plot)
load_button.pack(side=tk.LEFT)
root.mainloop()
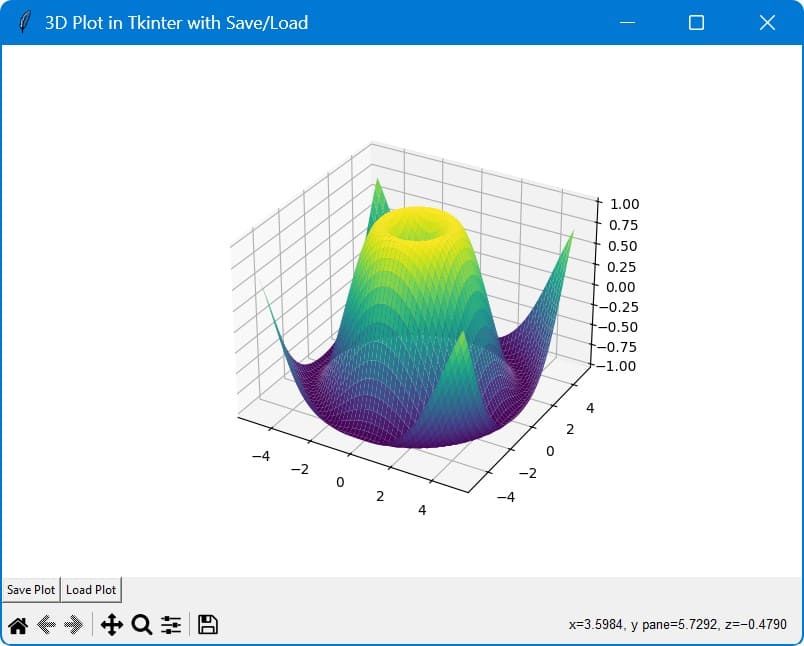
Output:
This code adds “Save Plot” and “Load Plot” buttons to the Tkinter window.
The save_plot function now retrieves the current elevation and azimuth angles using ax.elev and ax.azim.
It stores these angles along with the Z data in a dictionary, which is then pickled and saved to a file.
The load_plot function loads the dictionary from the file, extracts the Z data, elevation, and azimuth angles, and updates the plot.
It uses ax.view_init(elev=elev, azim=azim) to restore the view angles.
Mokhtar is the founder of LikeGeeks.com. He is a seasoned technologist and accomplished author, with expertise in Linux system administration and Python development. Since 2010, Mokhtar has built an impressive career, transitioning from system administration to Python development in 2015. His work spans large corporations to freelance clients around the globe. Alongside his technical work, Mokhtar has authored some insightful books in his field. Known for his innovative solutions, meticulous attention to detail, and high-quality work, Mokhtar continually seeks new challenges within the dynamic field of technology.

