Draw Bounding Box Around Matplotlib 3D Plots in Python
In this tutorial, you’ll learn how to draw bounding boxes around 3D plots in Python using Matplotlib.
You’ll explore various methods to create, customize, and optimize bounding boxes for different types of 3D plots.
Calculate Bounding Box Coordinates
To create a bounding box, you first need to determine its coordinates.
You can do this by finding the minimum and maximum values for each axis in your data.
Here’s how you can calculate the bounding box coordinates for a simple 3D scatter plot:
import numpy as np
np.random.seed(42)
data = np.random.rand(100, 3) * 10
x_min, x_max = data[:, 0].min(), data[:, 0].max()
y_min, y_max = data[:, 1].min(), data[:, 1].max()
z_min, z_max = data[:, 2].min(), data[:, 2].max()
print(f"X range: {x_min:.2f} to {x_max:.2f}")
print(f"Y range: {y_min:.2f} to {y_max:.2f}")
print(f"Z range: {z_min:.2f} to {z_max:.2f}")
Output:
X range: 0.06 to 9.90
Y range: 0.05 to 9.86
Z range: 0.07 to 9.70
The code generates random 3D data points and calculates the minimum and maximum values for each axis.
These values define the corners of the bounding box.
For different data types, you need to adjust your method to calculate the bounding box coordinates.
Here’s an example for a surface plot:
x = np.linspace(-5, 5, 50)
y = np.linspace(-5, 5, 50)
X, Y = np.meshgrid(x, y)
Z = np.sin(np.sqrt(X**2 + Y**2))
x_min, x_max = X.min(), X.max()
y_min, y_max = Y.min(), Y.max()
z_min, z_max = Z.min(), Z.max()
print(f"X range: {x_min:.2f} to {x_max:.2f}")
print(f"Y range: {y_min:.2f} to {y_max:.2f}")
print(f"Z range: {z_min:.2f} to {z_max:.2f}")
Output:
X range: -5.00 to 5.00
Y range: -5.00 to 5.00
Z range: -1.00 to 1.00
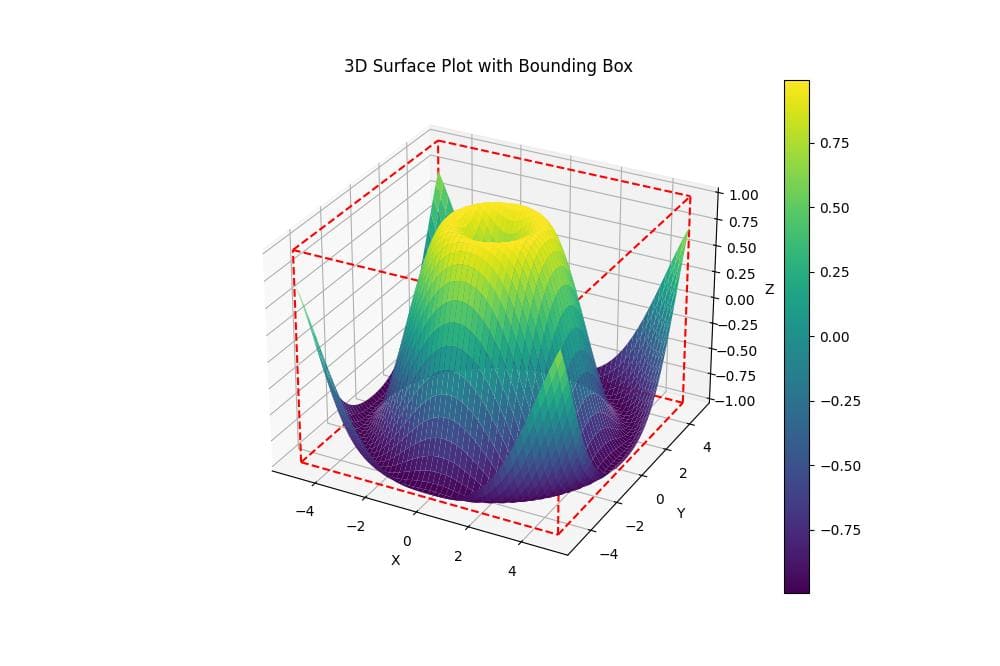
For surface plots, you need to consider the entire mesh grid when calculating the bounding box coordinates.
Draw the Bounding Box
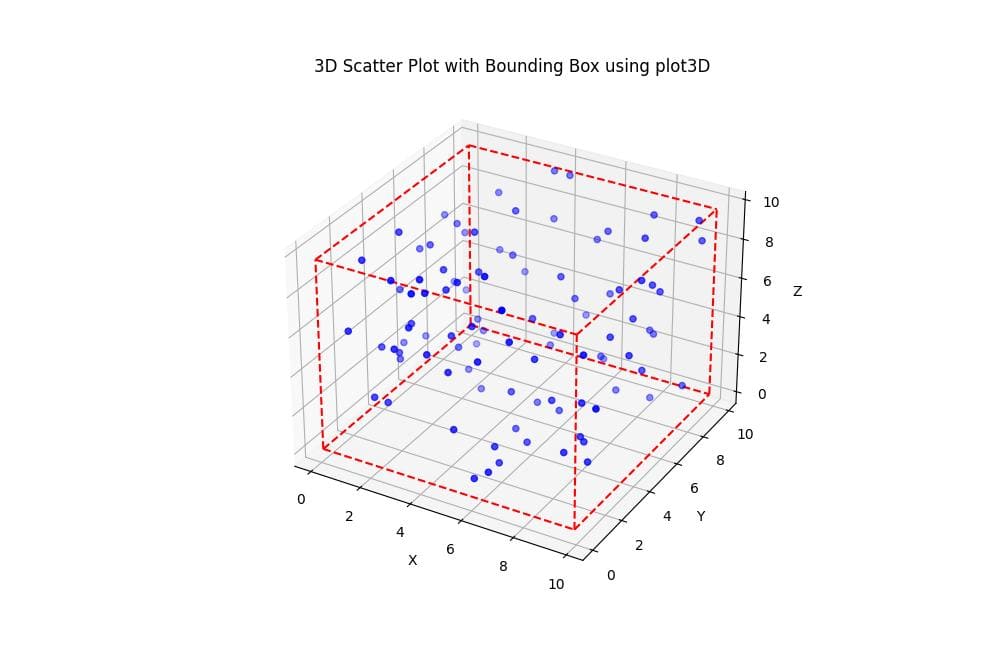
You can draw the bounding box using Matplotlib plot3D function:
import matplotlib.pyplot as plt
from mpl_toolkits.mplot3d import Axes3D
np.random.seed(42)
data = np.random.rand(100, 3) * 10
x_min, x_max = data[:, 0].min(), data[:, 0].max()
y_min, y_max = data[:, 1].min(), data[:, 1].max()
z_min, z_max = data[:, 2].min(), data[:, 2].max()
fig = plt.figure(figsize=(10, 8))
ax = fig.add_subplot(111, projection='3d')
ax.scatter(data[:, 0], data[:, 1], data[:, 2], c='b', marker='o')
ax.plot3D([x_min, x_max], [y_min, y_min], [z_min, z_min], 'r--')
ax.plot3D([x_min, x_max], [y_max, y_max], [z_min, z_min], 'r--')
ax.plot3D([x_min, x_max], [y_min, y_min], [z_max, z_max], 'r--')
ax.plot3D([x_min, x_max], [y_max, y_max], [z_max, z_max], 'r--')
ax.plot3D([x_min, x_min], [y_min, y_max], [z_min, z_min], 'r--')
ax.plot3D([x_max, x_max], [y_min, y_max], [z_min, z_min], 'r--')
ax.plot3D([x_min, x_min], [y_min, y_max], [z_max, z_max], 'r--')
ax.plot3D([x_max, x_max], [y_min, y_max], [z_max, z_max], 'r--')
ax.plot3D([x_min, x_min], [y_min, y_min], [z_min, z_max], 'r--')
ax.plot3D([x_max, x_max], [y_min, y_min], [z_min, z_max], 'r--')
ax.plot3D([x_min, x_min], [y_max, y_max], [z_min, z_max], 'r--')
ax.plot3D([x_max, x_max], [y_max, y_max], [z_min, z_max], 'r--')
ax.set_xlabel('X')
ax.set_ylabel('Y')
ax.set_zlabel('Z')
ax.set_title('3D Scatter Plot with Bounding Box using plot3D')
plt.show()
Output:
This method uses plot3D to draw each edge of the bounding box individually. It provides more control over the appearance of each edge.
Handle Different Plot Types
Surface Plots
For surface plots, you can adapt the bounding box drawing method:
import numpy as np
import matplotlib.pyplot as plt
from mpl_toolkits.mplot3d import Axes3D
from itertools import product, combinations
def plot_3d_surface_with_bbox(X, Y, Z):
    fig = plt.figure(figsize=(10, 8))
    ax = fig.add_subplot(111, projection='3d')
    surf = ax.plot_surface(X, Y, Z, cmap='viridis')
    x_min, x_max = X.min(), X.max()
    y_min, y_max = Y.min(), Y.max()
    z_min, z_max = Z.min(), Z.max()
    for s, e in combinations(np.array(list(product([x_min, x_max], [y_min, y_max], [z_min, z_max]))), 2):
        if np.sum(np.abs(s-e)) == x_max-x_min or np.sum(np.abs(s-e)) == y_max-y_min or np.sum(np.abs(s-e)) == z_max-z_min:
            ax.plot3D(*zip(s, e), color="r", linestyle="--")
    ax.set_xlabel('X')
    ax.set_ylabel('Y')
    ax.set_zlabel('Z')
    ax.set_title('3D Surface Plot with Bounding Box')
    plt.colorbar(surf)
    plt.show()
x = np.linspace(-5, 5, 50)
y = np.linspace(-5, 5, 50)
X, Y = np.meshgrid(x, y)
Z = np.sin(np.sqrt(X**2 + Y**2))
plot_3d_surface_with_bbox(X, Y, Z)
Output:
Wireframe Plots
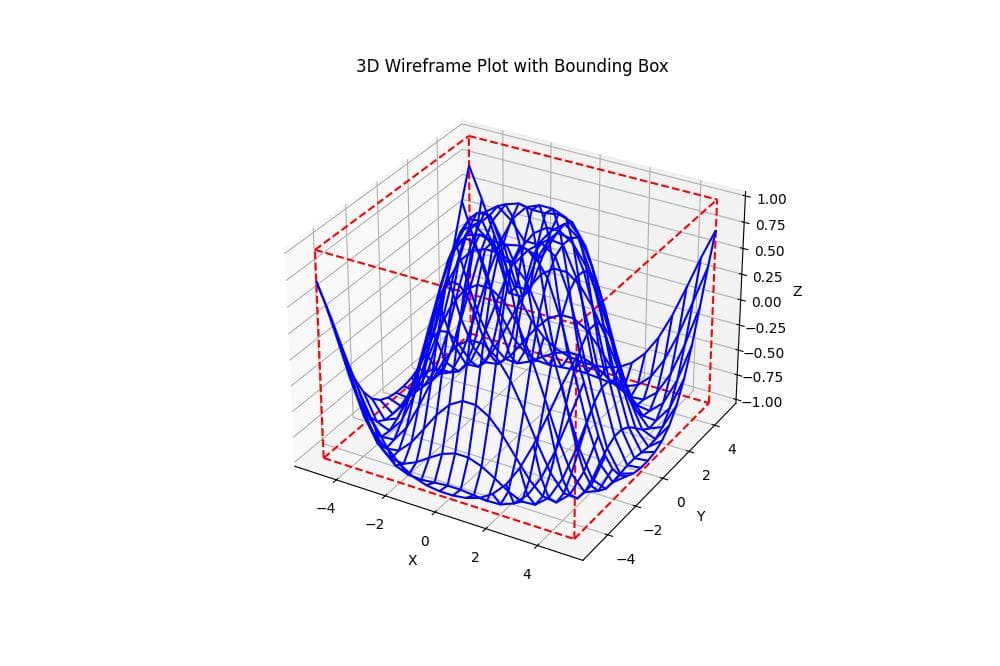
For wireframe plots, you can use a similar approach:
import numpy as np
import matplotlib.pyplot as plt
from mpl_toolkits.mplot3d import Axes3D
from itertools import product, combinations
def plot_3d_wireframe_with_bbox(X, Y, Z):
    fig = plt.figure(figsize=(10, 8))
    ax = fig.add_subplot(111, projection='3d')
    ax.plot_wireframe(X, Y, Z, color='b')
    x_min, x_max = X.min(), X.max()
    y_min, y_max = Y.min(), Y.max()
    z_min, z_max = Z.min(), Z.max()
    for s, e in combinations(np.array(list(product([x_min, x_max], [y_min, y_max], [z_min, z_max]))), 2):
        if np.sum(np.abs(s-e)) == x_max-x_min or np.sum(np.abs(s-e)) == y_max-y_min or np.sum(np.abs(s-e)) == z_max-z_min:
            ax.plot3D(*zip(s, e), color="r", linestyle="--")
    ax.set_xlabel('X')
    ax.set_ylabel('Y')
    ax.set_zlabel('Z')
    ax.set_title('3D Wireframe Plot with Bounding Box')
    plt.show()
x = np.linspace(-5, 5, 20)
y = np.linspace(-5, 5, 20)
X, Y = np.meshgrid(x, y)
Z = np.sin(np.sqrt(X**2 + Y**2))
plot_3d_wireframe_with_bbox(X, Y, Z)
Output:
This function creates a 3D wireframe plot with a bounding box, using the same bounding box method as before.
Volumetric Data
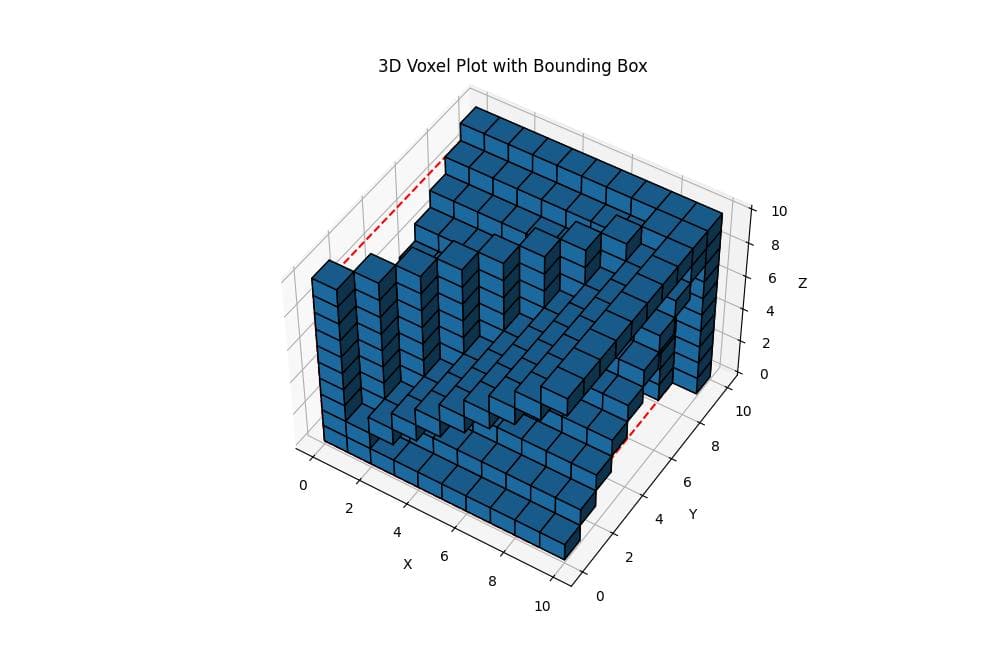
For volumetric data, you can use the voxels function to create a 3D plot:
import numpy as np
import matplotlib.pyplot as plt
from mpl_toolkits.mplot3d import Axes3D
from itertools import product, combinations
def plot_3d_voxels_with_bbox(voxels):
  fig = plt.figure(figsize=(10, 8))
  ax = fig.add_subplot(111, projection='3d')
  ax.voxels(voxels, edgecolor='k')
  x_min, x_max = 0, voxels.shape[0] - 1
  y_min, y_max = 0, voxels.shape[1] - 1
  z_min, z_max = 0, voxels.shape[2] - 1
  for s, e in combinations(np.array(list(product([x_min, x_max], [y_min, y_max], [z_min, z_max]))), 2):
      if np.sum(np.abs(s-e)) == x_max-x_min or np.sum(np.abs(s-e)) == y_max-y_min or np.sum(np.abs(s-e)) == z_max-z_min:
          ax.plot3D(*zip(s, e), color="r", linestyle="--")
  ax.set_xlabel('X')
  ax.set_ylabel('Y')
  ax.set_zlabel('Z')
  ax.set_title('3D Voxel Plot with Bounding Box')
  plt.show()
x, y, z = np.indices((10, 10, 10))
voxels = (x == y) | (y == z) | (x == z)
plot_3d_voxels_with_bbox(voxels)
Output:
This function creates a 3D voxel plot with a bounding box. The voxel data is represented as a boolean 3D array, where True values are shown as filled cubes.
Dynamically Adjust the Bounding Box
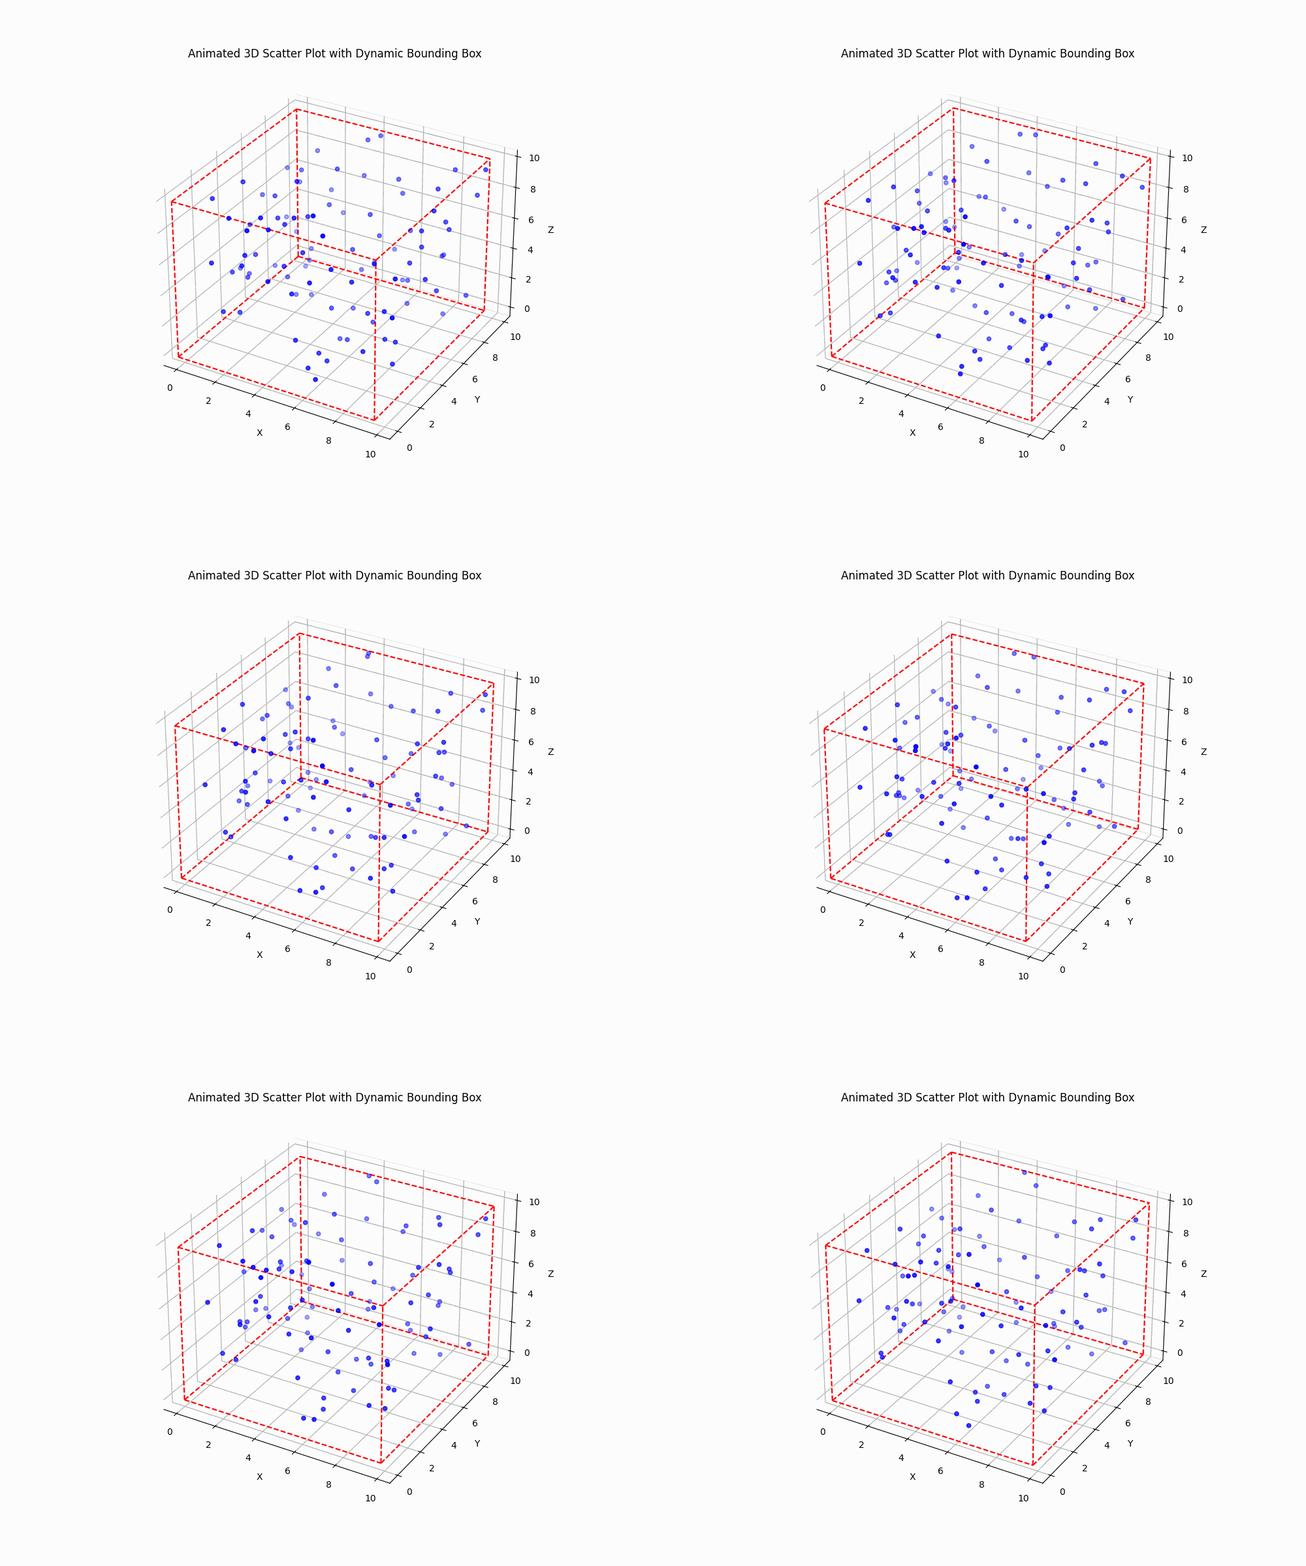
To create an animated plot with a dynamically adjusting bounding box, you can use Matplotlib animation functionality:
import numpy as np
import matplotlib.pyplot as plt
from mpl_toolkits.mplot3d import Axes3D
from matplotlib.animation import FuncAnimation
from itertools import product, combinations
def update_plot(frame, data, scatter, bbox_lines):
    # Update data
    new_data = data + np.random.randn(100, 3) * 0.2
    scatter._offsets3d = (new_data[:, 0], new_data[:, 1], new_data[:, 2])

    # Update bounding box
    x_min, x_max = new_data[:, 0].min(), new_data[:, 0].max()
    y_min, y_max = new_data[:, 1].min(), new_data[:, 1].max()
    z_min, z_max = new_data[:, 2].min(), new_data[:, 2].max()
    bbox_coords = list(product([x_min, x_max], [y_min, y_max], [z_min, z_max]))
    line_index = 0
    for s, e in combinations(bbox_coords, 2):
        if np.sum(np.abs(np.array(s) - np.array(e))) in [x_max-x_min, y_max-y_min, z_max-z_min]:
            bbox_lines[line_index].set_data_3d(*zip(s, e))
            line_index += 1
    return scatter, *bbox_lines
np.random.seed(42)
data = np.random.rand(100, 3) * 10
fig = plt.figure(figsize=(10, 8))
ax = fig.add_subplot(111, projection='3d')
scatter = ax.scatter(data[:, 0], data[:, 1], data[:, 2], c='b', marker='o')
x_min, x_max = data[:, 0].min(), data[:, 0].max()
y_min, y_max = data[:, 1].min(), data[:, 1].max()
z_min, z_max = data[:, 2].min(), data[:, 2].max()
bbox_lines = []
for s, e in combinations(np.array(list(product([x_min, x_max], [y_min, y_max], [z_min, z_max]))), 2):
    if np.sum(np.abs(np.array(s) - np.array(e))) in [x_max-x_min, y_max-y_min, z_max-z_min]:
        line, = ax.plot3D(*zip(s, e), color="r", linestyle="--")
        bbox_lines.append(line)
ax.set_xlabel('X')
ax.set_ylabel('Y')
ax.set_zlabel('Z')
ax.set_title('Animated 3D Scatter Plot with Dynamic Bounding Box')
anim = FuncAnimation(fig, update_plot, frames=100, fargs=(data, scatter, bbox_lines),
                     interval=50, blit=False)
plt.show()
Output:
This code creates an animated 3D scatter plot where both the data points and the bounding box are updated in each frame.
Highlight Bounding Box
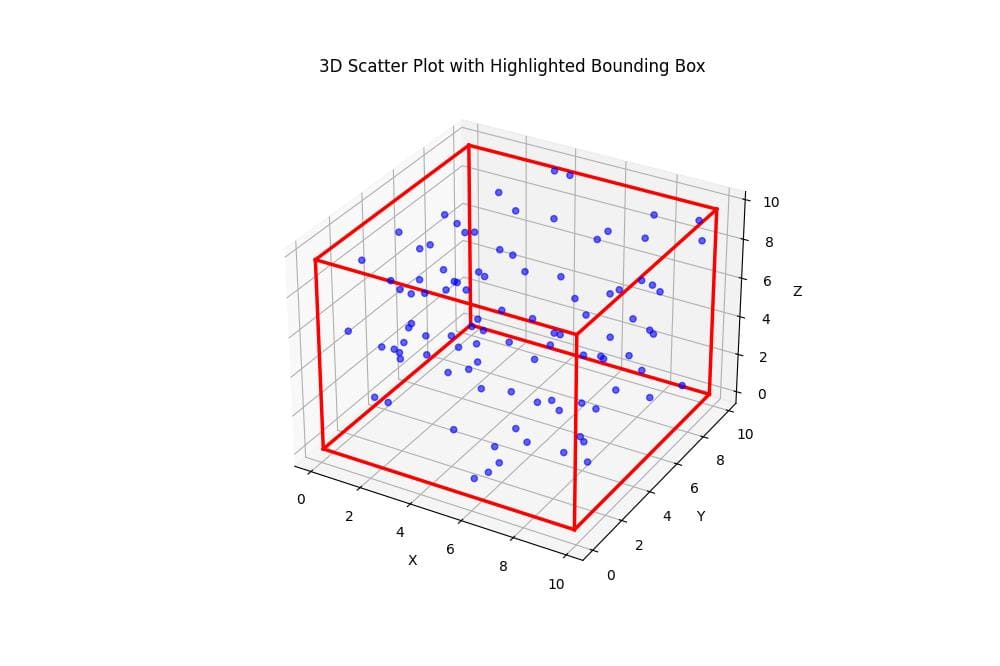
You can adjust the bounding box color, line style, and width:
import numpy as np
import matplotlib.pyplot as plt
from mpl_toolkits.mplot3d import Axes3D
from itertools import product, combinations
def plot_3d_scatter_with_highlighted_bbox(data):
  fig = plt.figure(figsize=(10, 8))
  ax = fig.add_subplot(111, projection='3d')
  scatter = ax.scatter(data[:, 0], data[:, 1], data[:, 2], c='b', marker='o', alpha=0.6)

  x_min, x_max = data[:, 0].min(), data[:, 0].max()
  y_min, y_max = data[:, 1].min(), data[:, 1].max()
  z_min, z_max = data[:, 2].min(), data[:, 2].max()
  for s, e in combinations(np.array(list(product([x_min, x_max], [y_min, y_max], [z_min, z_max]))), 2):
      if np.sum(np.abs(s-e)) == x_max-x_min or np.sum(np.abs(s-e)) == y_max-y_min or np.sum(np.abs(s-e)) == z_max-z_min:
          ax.plot3D(*zip(s, e), color="r", linestyle="-", linewidth=2.5)
  ax.set_xlabel('X')
  ax.set_ylabel('Y')
  ax.set_zlabel('Z')
  ax.set_title('3D Scatter Plot with Highlighted Bounding Box')
  plt.show()
np.random.seed(42)
data = np.random.rand(100, 3) * 10
plot_3d_scatter_with_highlighted_bbox(data)
Output:
This function creates a 3D scatter plot with a bounding box using solid red lines with increased line width.
Bounding Boxes for Subplots
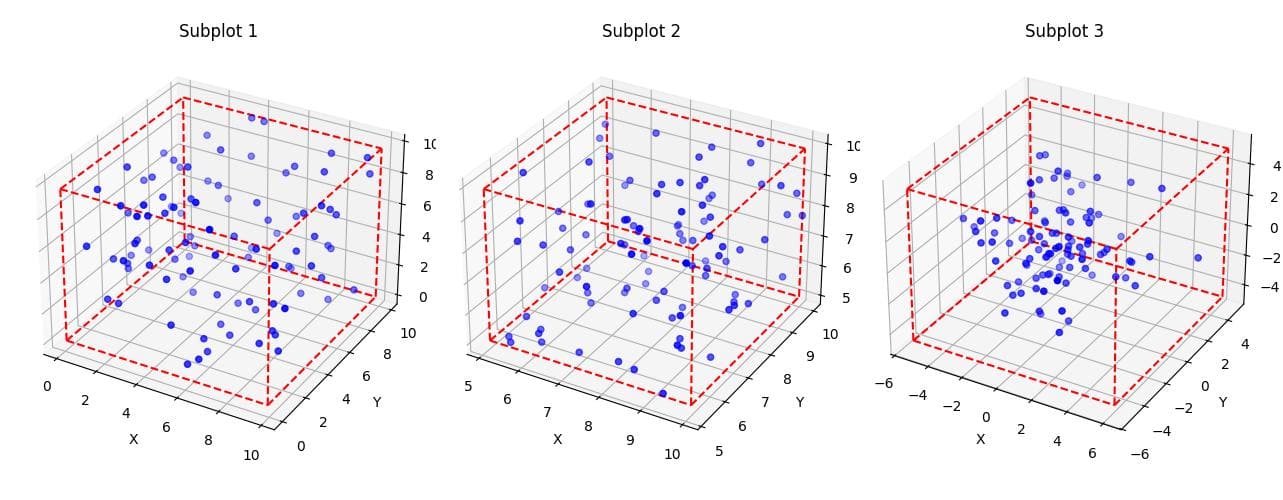
To create bounding boxes for multiple subplots, you can use a loop to generate multiple 3D axes:
import numpy as np
import matplotlib.pyplot as plt
from mpl_toolkits.mplot3d import Axes3D
from itertools import product, combinations
def plot_multiple_3d_scatter_with_bbox(data_list):
  fig = plt.figure(figsize=(15, 5))
  for i, data in enumerate(data_list, 1):
      ax = fig.add_subplot(1, 3, i, projection='3d')
      scatter = ax.scatter(data[:, 0], data[:, 1], data[:, 2], c='b', marker='o')
      x_min, x_max = data[:, 0].min(), data[:, 0].max()
      y_min, y_max = data[:, 1].min(), data[:, 1].max()
      z_min, z_max = data[:, 2].min(), data[:, 2].max()
      for s, e in combinations(np.array(list(product([x_min, x_max], [y_min, y_max], [z_min, z_max]))), 2):
          if np.sum(np.abs(s-e)) == x_max-x_min or np.sum(np.abs(s-e)) == y_max-y_min or np.sum(np.abs(s-e)) == z_max-z_min:
              ax.plot3D(*zip(s, e), color="r", linestyle="--")
      ax.set_xlabel('X')
      ax.set_ylabel('Y')
      ax.set_zlabel('Z')
      ax.set_title(f'Subplot {i}')
  plt.tight_layout()
  plt.show()
np.random.seed(42)
data1 = np.random.rand(100, 3) * 10
data2 = np.random.rand(100, 3) * 5 + 5
data3 = np.random.randn(100, 3) * 2
plot_multiple_3d_scatter_with_bbox([data1, data2, data3])
Output:
This function creates three 3D scatter plots with bounding boxes in a single figure.
Mokhtar is the founder of LikeGeeks.com. He is a seasoned technologist and accomplished author, with expertise in Linux system administration and Python development. Since 2010, Mokhtar has built an impressive career, transitioning from system administration to Python development in 2015. His work spans large corporations to freelance clients around the globe. Alongside his technical work, Mokhtar has authored some insightful books in his field. Known for his innovative solutions, meticulous attention to detail, and high-quality work, Mokhtar continually seeks new challenges within the dynamic field of technology.

