Plot 3D Hyperbolic Curves in Python using Matplotlib
In this tutorial, you’ll learn how to create various 3D hyperbolic curves using Python.
You’ll use libraries like NumPy and Matplotlib to generate and visualize these mathematical shapes.
Simple 3D Hyperbolic Curve
To create a simple 3D hyperbolic curve, you can use NumPy to generate the data and Matplotlib to plot it:
import numpy as np
import matplotlib.pyplot as plt
x = np.linspace(-10, 10, 100)
y = np.linspace(-10, 10, 100)
X, Y = np.meshgrid(x, y)
Z = np.sqrt(1 + X**2 + Y**2)
fig = plt.figure(figsize=(10, 8))
ax = fig.add_subplot(111, projection='3d')
ax.plot_surface(X, Y, Z, cmap='viridis')
ax.set_xlabel('X')
ax.set_ylabel('Y')
ax.set_zlabel('Z')
ax.set_title('Simple 3D Hyperbolic Curve')
plt.show()
Output:
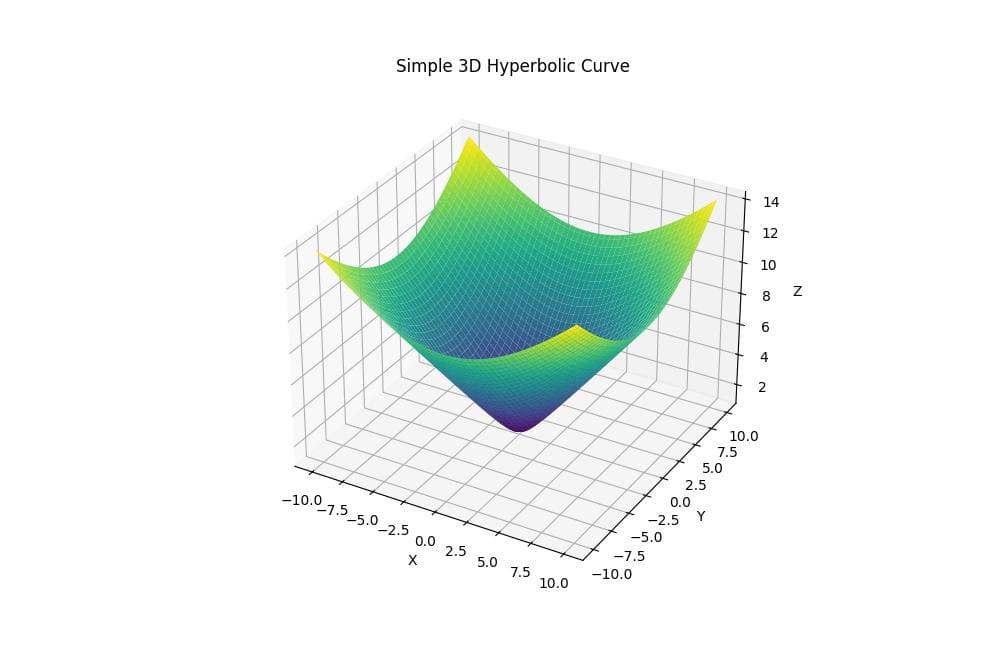
The Z values are calculated using the equation Z = √(1 + X² + Y²).
The resulting plot shows a smooth, upward-curving surface that extends infinitely in all directions.
3D Hyperbolic Paraboloid
To generate a 3D hyperbolic paraboloid, you can use the following code:
import numpy as np
import matplotlib.pyplot as plt
x = np.linspace(-5, 5, 100)
y = np.linspace(-5, 5, 100)
X, Y = np.meshgrid(x, y)
Z = X**2 - Y**2
fig = plt.figure(figsize=(10, 8))
ax = fig.add_subplot(111, projection='3d')
surf = ax.plot_surface(X, Y, Z, cmap='coolwarm')
ax.set_xlabel('X')
ax.set_ylabel('Y')
ax.set_zlabel('Z')
ax.set_title('3D Hyperbolic Paraboloid')
fig.colorbar(surf)
plt.show()
Output:
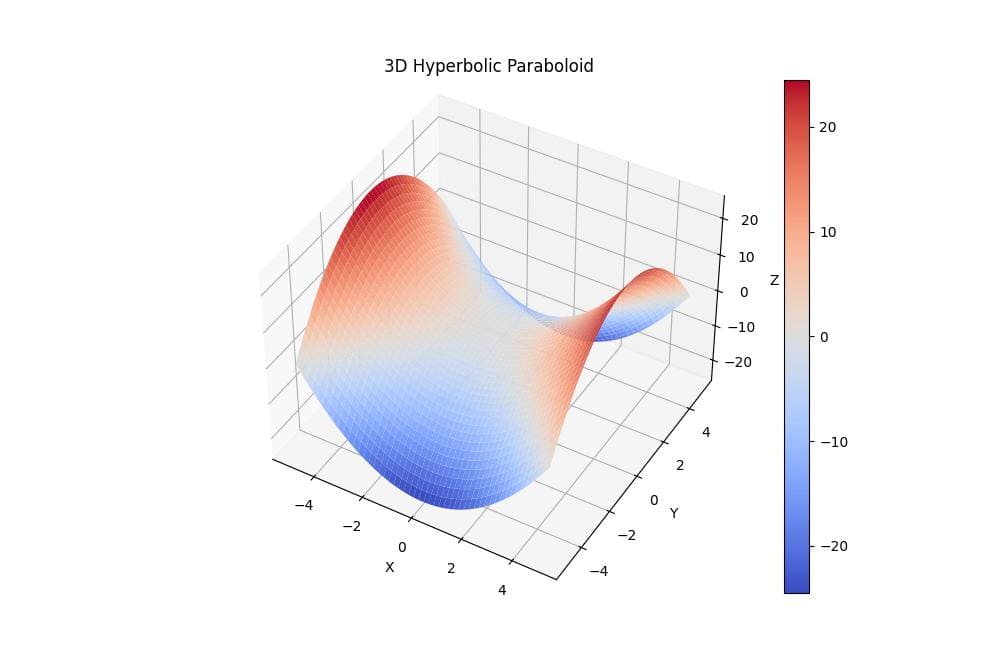
This code creates a 3D surface plot of a hyperbolic paraboloid using the equation Z = X² – Y².
The resulting plot shows a saddle-shaped surface with a central point where the curvature changes direction.
Hyperboloid of One Sheet
You can create a hyperboloid of one sheet using the following code:
import numpy as np
import matplotlib.pyplot as plt
theta = np.linspace(0, 2*np.pi, 100)
z = np.linspace(-2, 2, 100)
Theta, Z = np.meshgrid(theta, z)
X = np.cosh(Z) * np.cos(Theta)
Y = np.cosh(Z) * np.sin(Theta)
fig = plt.figure(figsize=(10, 8))
ax = fig.add_subplot(111, projection='3d')
ax.plot_surface(X, Y, Z, cmap='plasma')
ax.set_xlabel('X')
ax.set_ylabel('Y')
ax.set_zlabel('Z')
ax.set_title('Hyperboloid of One Sheet')
plt.show()
Output:
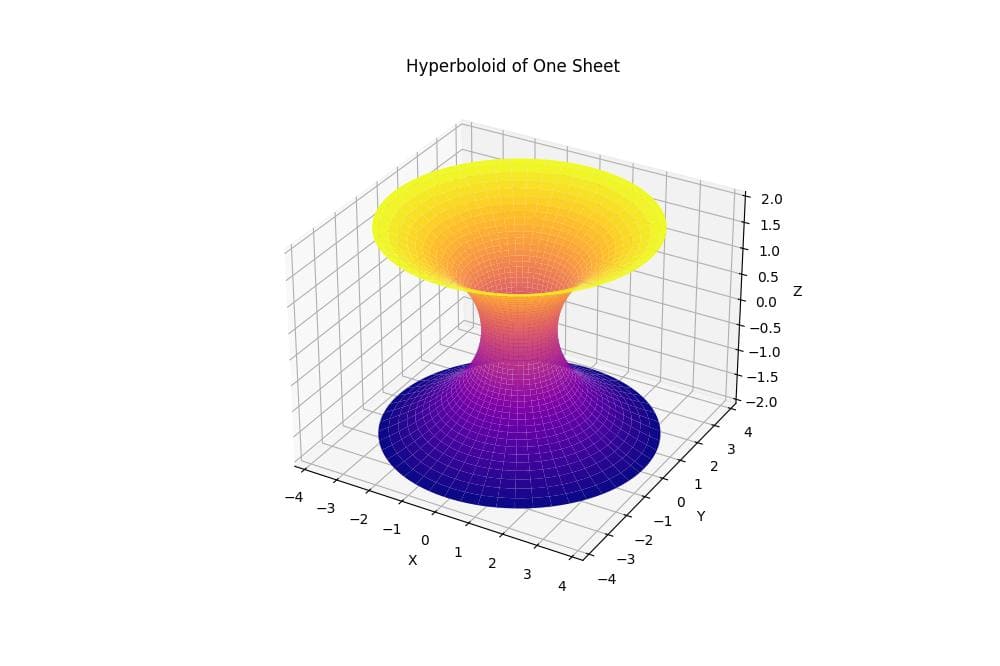
The resulting plot shows a symmetric, hourglass-shaped surface that narrows in the middle and extends outwards at both ends.
Hyperboloid of Two Sheets
To create a hyperboloid of two sheets, you can use this code:
import numpy as np
import matplotlib.pyplot as plt
theta = np.linspace(0, 2*np.pi, 100)
z = np.linspace(-2, 2, 100)
Theta, Z = np.meshgrid(theta, z)
X = np.sinh(Z) * np.cos(Theta)
Y = np.sinh(Z) * np.sin(Theta)
fig = plt.figure(figsize=(10, 8))
ax = fig.add_subplot(111, projection='3d')
ax.plot_surface(X, Y, Z, cmap='viridis')
ax.set_xlabel('X')
ax.set_ylabel('Y')
ax.set_zlabel('Z')
ax.set_title('Hyperboloid of Two Sheets')
plt.show()
Output:
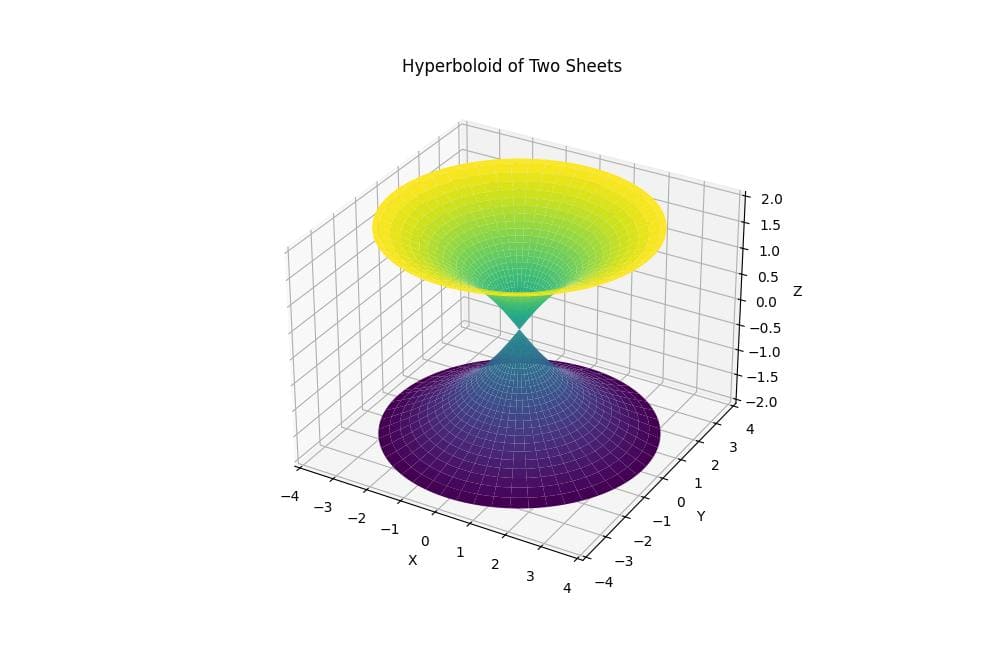
The resulting plot shows two separate, bowl-shaped surfaces that open away from each other along the Z-axis.
Hyperbolic Helicoid
To create a hyperbolic helicoid, you can use the following code:
import numpy as np
import matplotlib.pyplot as plt
u = np.linspace(-10, 10, 100)
v = np.linspace(-10, 10, 100)
U, V = np.meshgrid(u, v)
X = U * np.cosh(V)
Y = U * np.sinh(V)
Z = V
fig = plt.figure(figsize=(10, 8))
ax = fig.add_subplot(111, projection='3d')
ax.plot_surface(X, Y, Z, cmap='coolwarm')
ax.set_xlabel('X')
ax.set_ylabel('Y')
ax.set_zlabel('Z')
ax.set_title('Hyperbolic Helicoid')
plt.show()
Output:
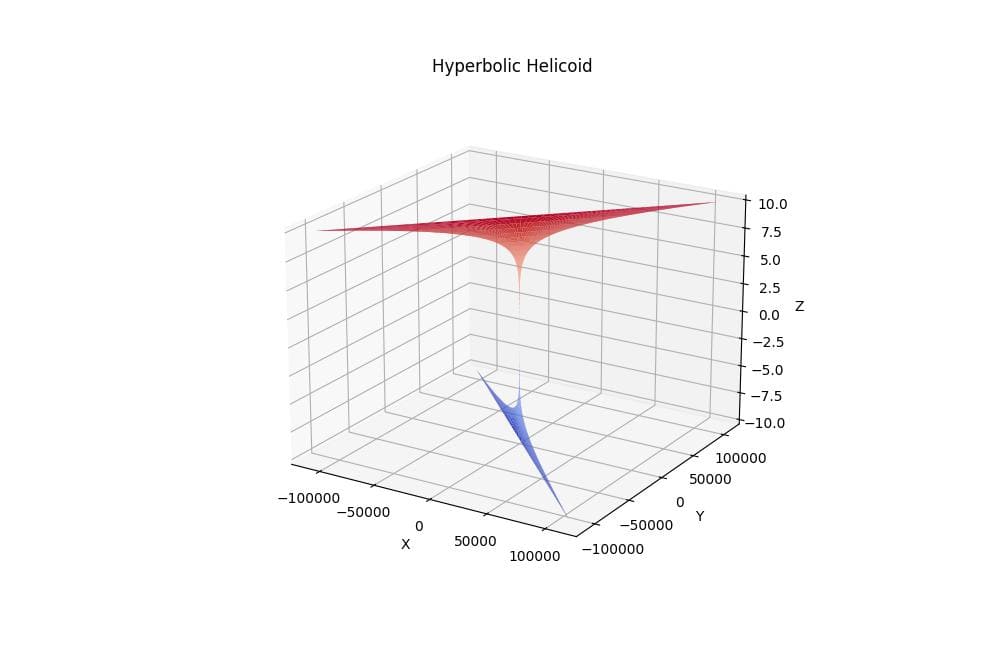
The resulting plot shows a twisted surface that spirals around the Z-axis, with the curvature increasing as it moves away from the center.
Hyperbolic Horn
To generate a hyperbolic horn, you can use this code:
import numpy as np
import matplotlib.pyplot as plt
theta = np.linspace(0, 2*np.pi, 100)
r = np.linspace(0.1, 2, 100)
Theta, R = np.meshgrid(theta, r)
X = R * np.cos(Theta)
Y = R * np.sin(Theta)
Z = 1 / R
fig = plt.figure(figsize=(10, 8))
ax = fig.add_subplot(111, projection='3d')
ax.plot_surface(X, Y, Z, cmap='magma')
ax.set_xlabel('X')
ax.set_ylabel('Y')
ax.set_zlabel('Z')
ax.set_title('Hyperbolic Horn')
plt.show()
Output:
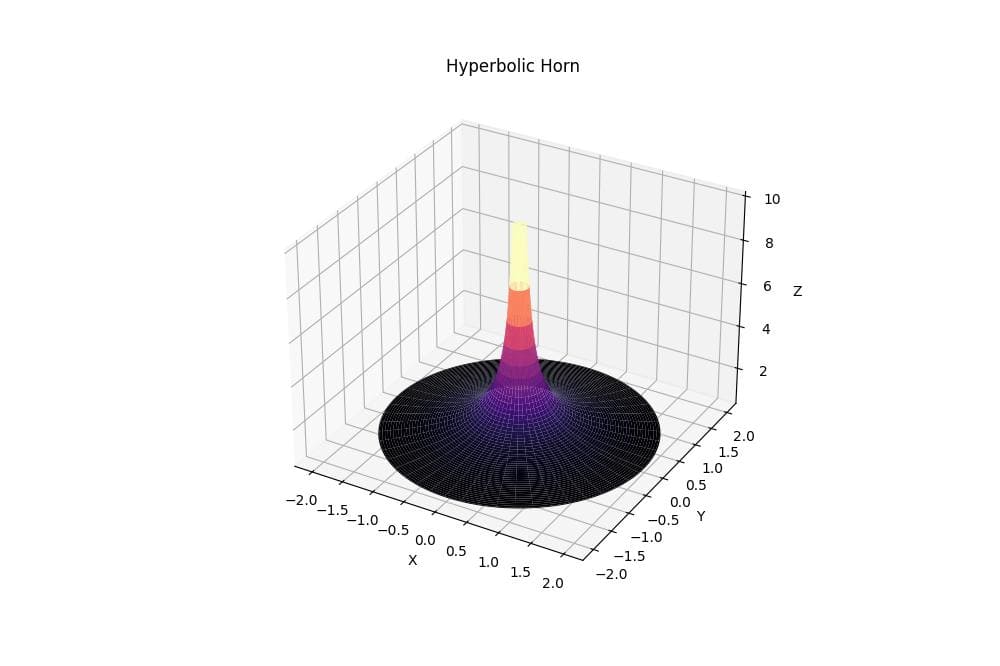
The resulting plot shows a horn-shaped surface that starts with a wide opening and narrows rapidly as it extends along the Z-axis.
Mokhtar is the founder of LikeGeeks.com. He is a seasoned technologist and accomplished author, with expertise in Linux system administration and Python development. Since 2010, Mokhtar has built an impressive career, transitioning from system administration to Python development in 2015. His work spans large corporations to freelance clients around the globe. Alongside his technical work, Mokhtar has authored some insightful books in his field. Known for his innovative solutions, meticulous attention to detail, and high-quality work, Mokhtar continually seeks new challenges within the dynamic field of technology.