Create 3D Plot in Spherical Coordinates with Python
In this tutorial, you’ll learn how to create 3D plots using spherical coordinates in Python.
Spherical coordinates provide a unique way to represent certain types of data and mathematical functions.
You’ll use NumPy for data manipulation and Matplotlib for plotting.
Generate data for spherical coordinates
To begin, you’ll need to generate data for your spherical coordinates.
You’ll create arrays for the radius (r), azimuthal angle (θ), and polar angle (φ).
import numpy as np
theta = np.linspace(0, 2*np.pi, 50)
phi = np.linspace(0, np.pi, 50)
theta, phi = np.meshgrid(theta, phi)
The np.linspace() function generates evenly spaced values within the specified ranges, and np.meshgrid() creates a 3D grid from these 1D arrays.
NumPy functions can generate more complex data based on these coordinates.
Here’s an example of creating a function that depends on r, θ, and φ:
r = 1.0
values = r * np.sin(phi) * np.cos(theta)
This code defines a simple spherical harmonic function and applies it to your coordinate arrays.
The resulting values array contains the function output for each point in the 3D grid.
Convert spherical coordinates to Cartesian
To plot your data using Matplotlib, you need to convert the spherical coordinates to Cartesian coordinates.
Here’s how you can implement the conversion formulas:
x = r * np.sin(phi) * np.cos(theta)
y = r * np.sin(phi) * np.sin(theta)
z = r * np.cos(phi)
These lines apply the standard formulas for converting from spherical to Cartesian coordinates.
Plot Surfaces in Spherical Coordinates
To create a 3D surface plot of your spherical data, you can use Matplotlib plot_surface() function:
import matplotlib.pyplot as plt
fig = plt.figure(figsize=(10, 8))
ax = fig.add_subplot(111, projection='3d')
surf = ax.plot_surface(x, y, z, facecolors=plt.cm.viridis(values), alpha=0.8)
ax.set_xlabel('X')
ax.set_ylabel('Y')
ax.set_zlabel('Z')
ax.set_title('3D Surface Plot in Spherical Coordinates')
plt.colorbar(surf, shrink=0.5, aspect=5)
plt.show()
Output:
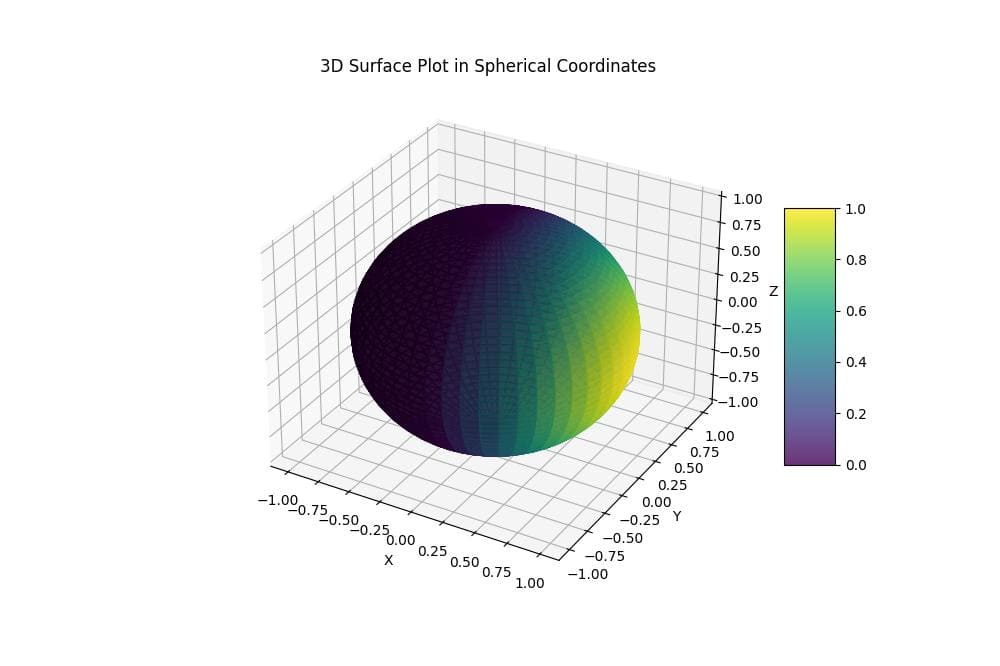
This code creates a 3D surface plot where the color of each point is determined by the values array.
The viridis colormap is used to map the values to colors, and alpha=0.8 makes the surface slightly transparent.
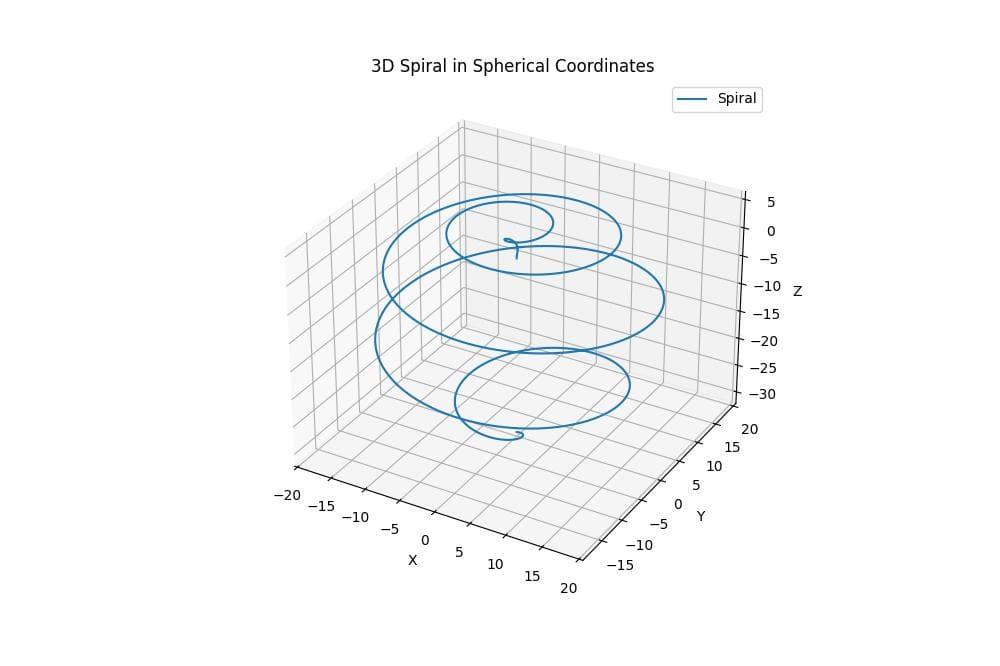
Plot Lines and Points in Spherical Coordinates
You can also plot lines and points in spherical coordinates. Here’s an example of plotting a spiral:
import matplotlib.pyplot as plt
t = np.linspace(0, 10*np.pi, 1000)
r = t
theta = t
phi = t/10
x = r * np.sin(phi) * np.cos(theta)
y = r * np.sin(phi) * np.sin(theta)
z = r * np.cos(phi)
fig = plt.figure(figsize=(10, 8))
ax = fig.add_subplot(111, projection='3d')
ax.plot(x, y, z, label='Spiral')
ax.set_xlabel('X')
ax.set_ylabel('Y')
ax.set_zlabel('Z')
ax.set_title('3D Spiral in Spherical Coordinates')
ax.legend()
plt.show()
Output:
Mokhtar is the founder of LikeGeeks.com. He is a seasoned technologist and accomplished author, with expertise in Linux system administration and Python development. Since 2010, Mokhtar has built an impressive career, transitioning from system administration to Python development in 2015. His work spans large corporations to freelance clients around the globe. Alongside his technical work, Mokhtar has authored some insightful books in his field. Known for his innovative solutions, meticulous attention to detail, and high-quality work, Mokhtar continually seeks new challenges within the dynamic field of technology.