Plot 3D Planes Intersection Using Python Matplotlib
In this tutorial, you’ll learn how to plot the intersection of 3D planes using the Python Matplotlib library.
Two Planes Intersecting
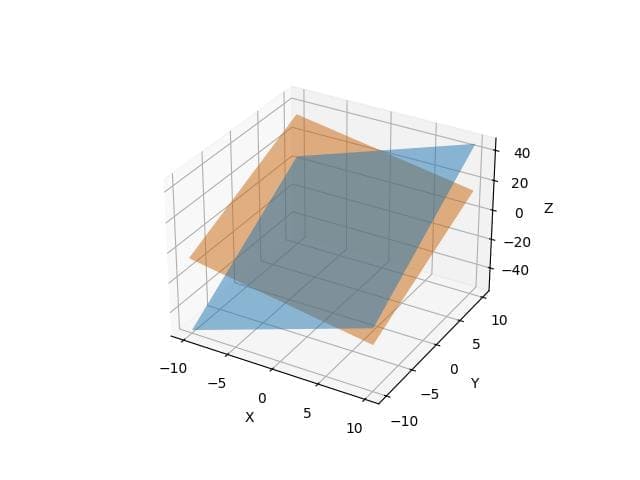
To plot two intersecting planes, you can use Matplotlib plot_surface function.
import numpy as np
import matplotlib.pyplot as plt
from mpl_toolkits.mplot3d import Axes3D
x = np.linspace(-10, 10, 100)
y = np.linspace(-10, 10, 100)
x, y = np.meshgrid(x, y)
z1 = 2 * x + 3 * y - 4
z2 = -x + 2 * y + 5
fig = plt.figure()
ax = fig.add_subplot(111, projection='3d')
ax.plot_surface(x, y, z1, alpha=0.5, rstride=100, cstride=100)
ax.plot_surface(x, y, z2, alpha=0.5, rstride=100, cstride=100)
ax.set_xlabel('X')
ax.set_ylabel('Y')
ax.set_zlabel('Z')
plt.show()
Output:
Three Planes Intersecting
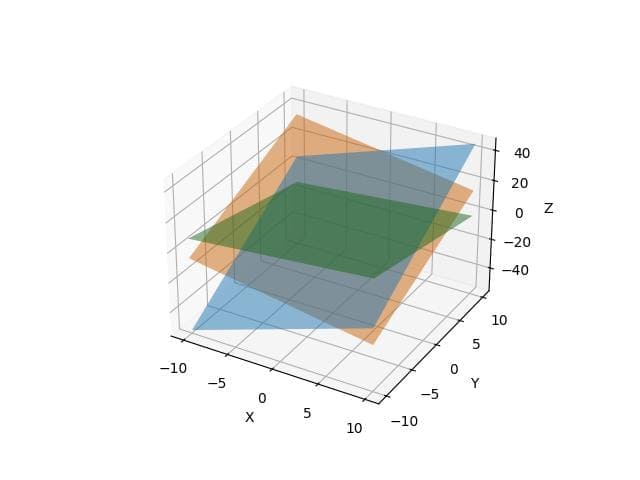
To visualize three planes intersecting at a single point, define three plane equations and plot them.
# Define three planes
z1 = 2 * x + 3 * y - 4
z2 = -x + 2 * y + 5
z3 = 0.5 * x - y + 3
fig = plt.figure()
ax = fig.add_subplot(111, projection='3d')
ax.plot_surface(x, y, z1, alpha=0.5, rstride=100, cstride=100)
ax.plot_surface(x, y, z2, alpha=0.5, rstride=100, cstride=100)
ax.plot_surface(x, y, z3, alpha=0.5, rstride=100, cstride=100)
ax.set_xlabel('X')
ax.set_ylabel('Y')
ax.set_zlabel('Z')
plt.show()
Output:
Multiple Planes Intersecting
To plot multiple planes, you can extend the previous example by adding more plane equations.
# Define additional planes
z4 = -0.5 * x + 0.5 * y + 2
z5 = x - y + 1
fig = plt.figure()
ax = fig.add_subplot(111, projection='3d')
ax.plot_surface(x, y, z1, alpha=0.5, rstride=100, cstride=100)
ax.plot_surface(x, y, z2, alpha=0.5, rstride=100, cstride=100)
ax.plot_surface(x, y, z3, alpha=0.5, rstride=100, cstride=100)
ax.plot_surface(x, y, z4, alpha=0.5, rstride=100, cstride=100)
ax.plot_surface(x, y, z5, alpha=0.5, rstride=100, cstride=100)
ax.set_xlabel('X')
ax.set_ylabel('Y')
ax.set_zlabel('Z')
plt.show()
Output:
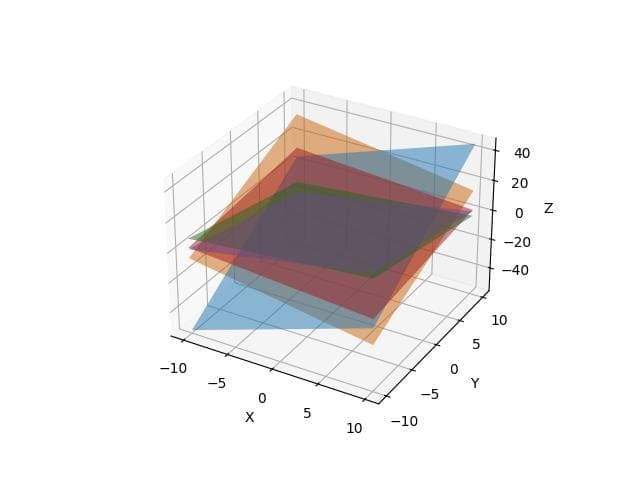
The plot now includes five planes, each defined by its equation.
The intersections between these planes form lines or points, depending on their orientation and position in space.
Highlight Intersection Line
To highlight the intersection line of two planes, calculate the line’s parametric equations and plot it.
# Calculate intersection line
a1, b1, c1 = 2, 3, -1
a2, b2, c2 = -1, 2, -1
d1, d2 = -4, 5

# Solve for intersection line
A = np.array([[a1, b1], [a2, b2]])
b = np.array([-d1, -d2])
x0, y0 = np.linalg.solve(A, b)

# Parametric line
t = np.linspace(-10, 10, 100)
x_line = x0 + t * (b1 * c2 - b2 * c1)
y_line = y0 + t * (a2 * c1 - a1 * c2)
z_line = c1 * x_line + c2 * y_line
fig = plt.figure()
ax = fig.add_subplot(111, projection='3d')
ax.plot_surface(x, y, z1, alpha=0.5, rstride=100, cstride=100)
ax.plot_surface(x, y, z2, alpha=0.5, rstride=100, cstride=100)
ax.plot(x_line, y_line, z_line, color='r', linewidth=2)
ax.set_xlabel('X')
ax.set_ylabel('Y')
ax.set_zlabel('Z')
plt.show()
Output:
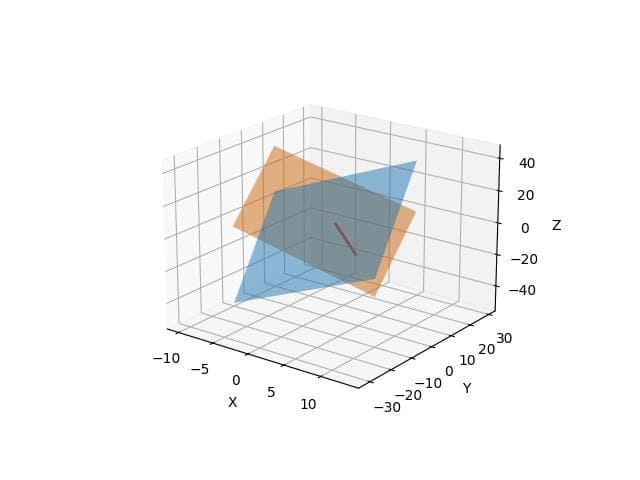
The red line represents the intersection of the two planes.
By solving the system of equations, you find the parametric form of the line where the planes intersect.
This line is then plotted over the planes to highlight their intersection.
Mokhtar is the founder of LikeGeeks.com. He is a seasoned technologist and accomplished author, with expertise in Linux system administration and Python development. Since 2010, Mokhtar has built an impressive career, transitioning from system administration to Python development in 2015. His work spans large corporations to freelance clients around the globe. Alongside his technical work, Mokhtar has authored some insightful books in his field. Known for his innovative solutions, meticulous attention to detail, and high-quality work, Mokhtar continually seeks new challenges within the dynamic field of technology.