Programmatic Zoom Methods for 3D Plots in Python
In this tutorial, you’ll learn various programmatic zoom methods for 3D plots in Python using Matplotlib.
You’ll explore methods to control axis limits, aspect ratios, and more, giving you fine-grained control over your 3D visualizations.
Axis Limits Adjustment
To zoom in on a specific region of your 3D plot, you can adjust the axis limits using set_xlim(), set_ylim(), and set_zlim().
Here’s how to implement this:
import matplotlib.pyplot as plt
import numpy as np
from mpl_toolkits.mplot3d import Axes3D
x = np.linspace(-5, 5, 100)
y = np.linspace(-5, 5, 100)
X, Y = np.meshgrid(x, y)
Z = np.sin(np.sqrt(X**2 + Y**2))
fig = plt.figure(figsize=(12, 5))

# Full view plot
ax1 = fig.add_subplot(121, projection='3d')
ax1.plot_surface(X, Y, Z)
ax1.set_title("Full View")

# Zoomed plot
ax2 = fig.add_subplot(122, projection='3d')
ax2.plot_surface(X, Y, Z)
ax2.set_xlim(-2, 2)
ax2.set_ylim(-2, 2)
ax2.set_zlim(0, 1)
ax2.set_title("Zoomed View")
plt.tight_layout()
plt.show()
Output:
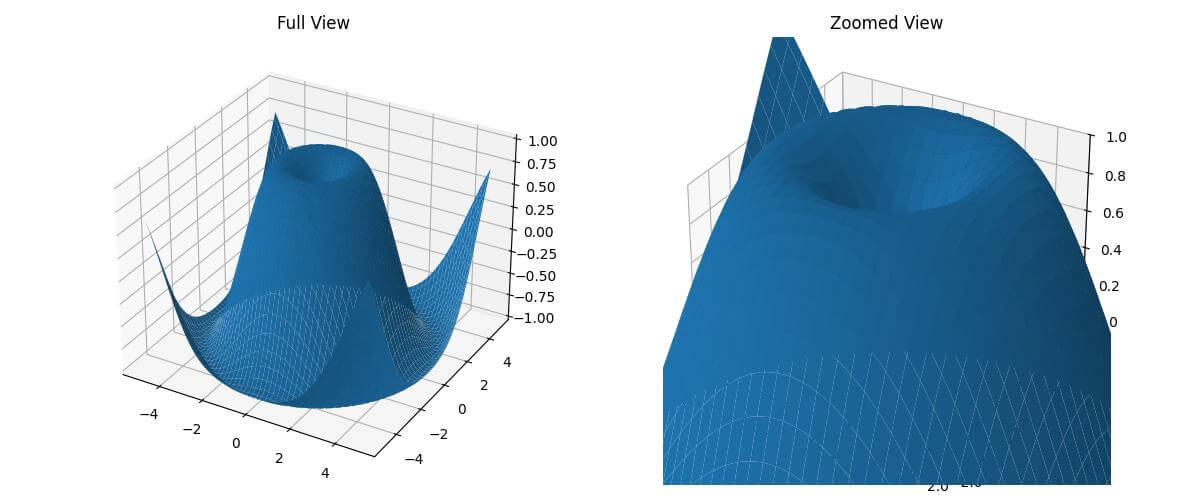
The zoomed view focuses on the central part of the plot by setting the x and y limits to [-2, 2] and the z limit to [0, 1].
Aspect ratio control
To control the aspect ratio of your 3D plot, you can use set_box_aspect() or set_aspect():
import matplotlib.pyplot as plt
import numpy as np
from mpl_toolkits.mplot3d import Axes3D
x = np.linspace(-5, 5, 20)
y = np.linspace(-5, 5, 20)
z = np.linspace(-5, 5, 20)
X, Y, Z = np.meshgrid(x, y, z)
fig = plt.figure(figsize=(12, 5))

# Default aspect ratio
ax1 = fig.add_subplot(121, projection='3d')
ax1.scatter(X, Y, Z, c=Z, cmap='viridis')
ax1.set_title("Default Aspect Ratio")

# Adjusted aspect ratio
ax2 = fig.add_subplot(122, projection='3d')
ax2.scatter(X, Y, Z, c=Z, cmap='viridis')
ax2.set_box_aspect((1, 2, 0.5))  # Set x:y:z aspect ratio to 1:2:0.5
ax2.set_title("Adjusted Aspect Ratio")
plt.tight_layout()
plt.show()
Output:
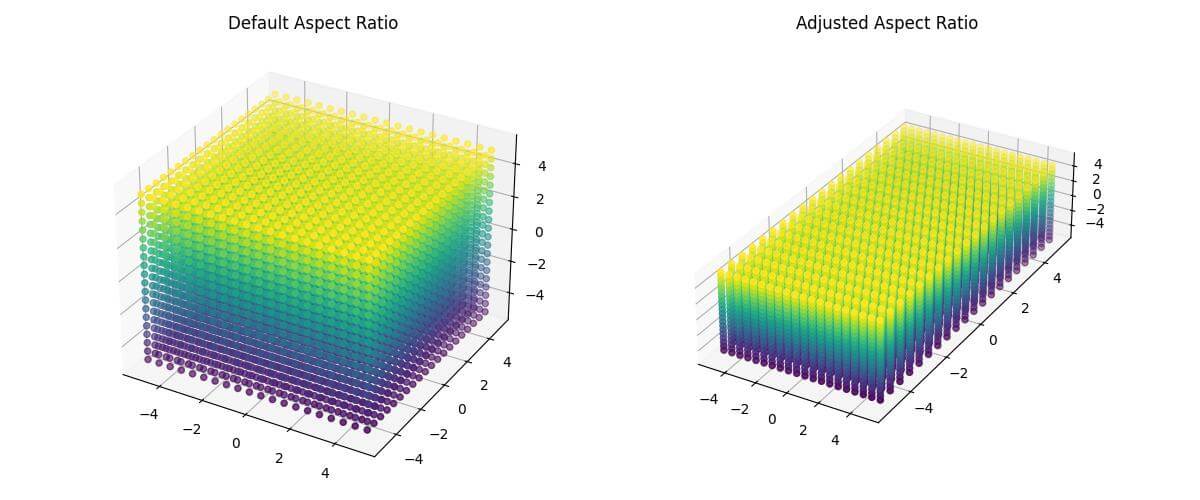
The first uses the default aspect ratio, while the second uses set_box_aspect() to set a custom aspect ratio of 1:2:0.5 for the x, y, and z axes respectively.
Clipping Planes
You can use clipping to show only a portion of your 3D plot:
import matplotlib.pyplot as plt
import numpy as np
from mpl_toolkits.mplot3d import Axes3D
x = np.linspace(-5, 5, 100)
y = np.linspace(-5, 5, 100)
X, Y = np.meshgrid(x, y)
Z = np.sin(np.sqrt(X**2 + Y**2))
fig = plt.figure(figsize=(12, 5))

# Full plot
ax1 = fig.add_subplot(121, projection='3d')
surf1 = ax1.plot_surface(X, Y, Z)
ax1.set_title("Full Plot")

# Clipped plot
ax2 = fig.add_subplot(122, projection='3d')
surf2 = ax2.plot_surface(X, Y, Z)
ax2.set_xlim(-2, 2)
ax2.set_ylim(-2, 2)
ax2.set_zlim(-1, 1)
surf2.set_clip_on(True)
ax2.set_title("Clipped Plot")
plt.tight_layout()
plt.show()
Output:
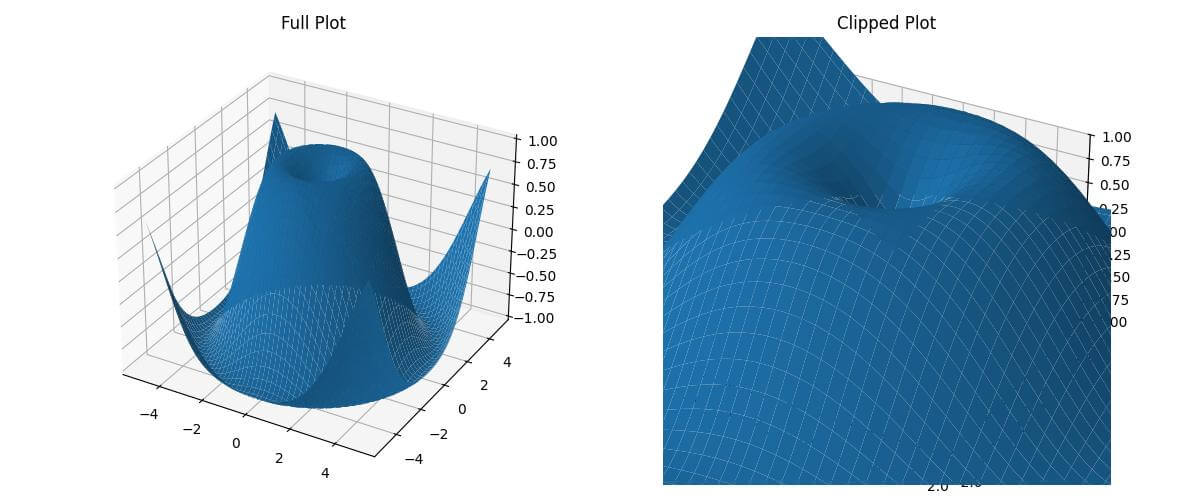
This code shows how to use set_clip_on() in combination with axis limits to show only a portion of the 3D surface.
The clipped plot focuses on the central region of the surface, hiding the parts outside the specified limits.
Subplot focus
You can use fig.add_axes to create a new 3D axis.
import matplotlib.pyplot as plt
import numpy as np
from mpl_toolkits.mplot3d import Axes3D
x = np.linspace(-5, 5, 100)
y = np.linspace(-5, 5, 100)
X, Y = np.meshgrid(x, y)
Z = np.sin(np.sqrt(X**2 + Y**2))
fig = plt.figure(figsize=(10, 8))
ax = fig.add_subplot(111, projection='3d')
surf = ax.plot_surface(X, Y, Z, cmap='viridis')
ax.set_title("Main Plot with Inset")

# Create inset axes as a new 3D subplot
axins = fig.add_axes([0.65, 0.65, 0.3, 0.3], projection='3d')
axins.plot_surface(X, Y, Z, cmap='viridis')
axins.set_xlim(-1, 1)
axins.set_ylim(-1, 1)
axins.set_zlim(0, 1)
axins.set_title("Zoomed Region")
plt.show()
Output:
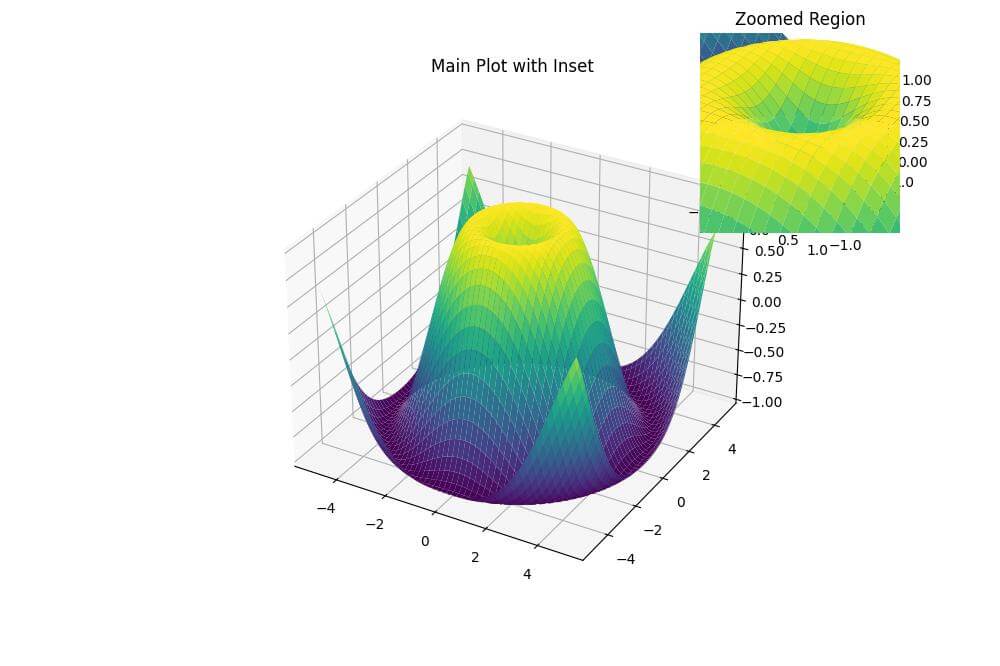
The parameters [0.65, 0.65, 0.3, 0.3] define the position and size of the inset axis in the figure.
You can adjust these values to position the inset as desired.
Zooming in on Specific Data Points
To focus on specific data points, you can create a separate plot with a subset of your data:
import matplotlib.pyplot as plt
import numpy as np
from mpl_toolkits.mplot3d import Axes3D
np.random.seed(42)
n_points = 1000
x = np.random.rand(n_points) * 10
y = np.random.rand(n_points) * 10
z = np.random.rand(n_points) * 10
fig = plt.figure(figsize=(12, 5))

# Full dataset
ax1 = fig.add_subplot(121, projection='3d')
ax1.scatter(x, y, z)
ax1.set_title("Full Dataset")

# Zoomed in on specific points
ax2 = fig.add_subplot(122, projection='3d')
mask = (x < 3) & (y < 3) & (z < 3)
x_zoom, y_zoom, z_zoom = x[mask], y[mask], z[mask]
ax2.scatter(x_zoom, y_zoom, z_zoom)
ax2.set_xlim(0, 3)
ax2.set_ylim(0, 3)
ax2.set_zlim(0, 3)
ax2.set_title("Zoomed in on Specific Points")
plt.tight_layout()
plt.show()
Output:
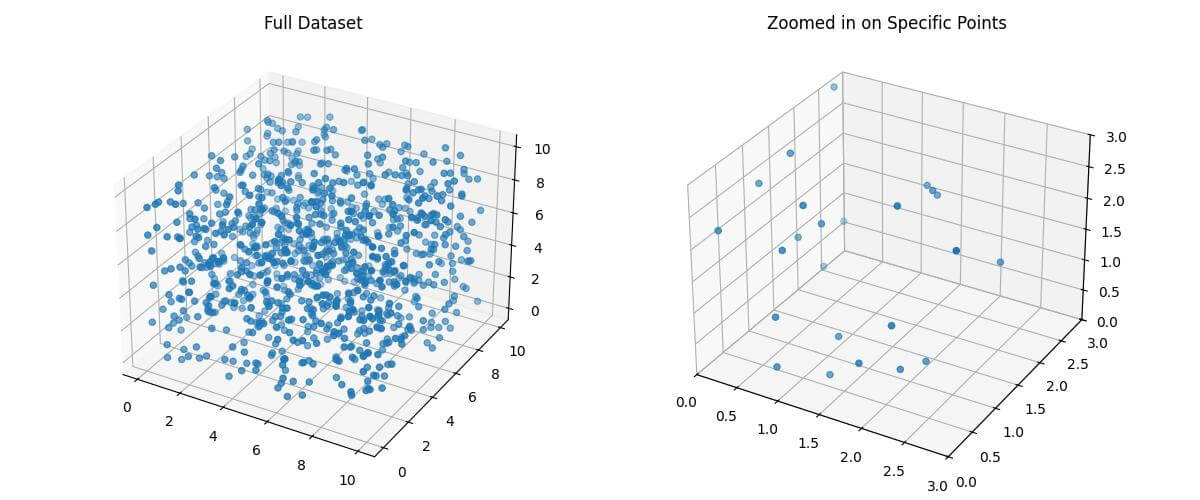
The first plot shows the entire dataset, while the second zooms in on a specific region (points where x, y, and z are all less than 3).
Mokhtar is the founder of LikeGeeks.com. He is a seasoned technologist and accomplished author, with expertise in Linux system administration and Python development. Since 2010, Mokhtar has built an impressive career, transitioning from system administration to Python development in 2015. His work spans large corporations to freelance clients around the globe. Alongside his technical work, Mokhtar has authored some insightful books in his field. Known for his innovative solutions, meticulous attention to detail, and high-quality work, Mokhtar continually seeks new challenges within the dynamic field of technology.