Convert Python Pandas DataFrame to HTML table using to_html
This to_html function in Pandas allows you to convert your DataFrame into an HTML table.
It’s highly customizable and flexible, enabling you to tailor the resulting HTML output according to your requirements.
This could include styling and formatting your data to suit your desired presentation.
- 1 Syntax and Parameters
- 2 Convert Pandas DataFrame to HTML table
- 3 Disable HTML Escaping
- 4 Choosing Columns
- 5 Limiting Rows and Columns
- 6 Customizing Headers and Indexes
- 7 Column Formatters
- 8 Decimal Separator
- 9 Floating Point Format
- 10 Showing Dimensions
- 11 Rendering Links
- 12 Column Spacing
- 13 Control Index Label Thickness
- 14 HTML Class Specification
- 15 Setting Table ID
- 16 Setting Borders
- 17 Setting Header Alignment
- 18 Jupyter Notebook Integration
- 19 Further Reading
Syntax and Parameters
The to_html function is straightforward to use. Here’s the basic syntax:
DataFrame.to_html(buf=None, columns=None, col_space=None,
 header=True, index=True, na_rep='NaN',
 formatters=None, float_format=None, sparsify=None,
 index_names=True, justify=None,
 max_rows=None, max_cols=None, show_dimensions=False,
 decimal='.', bold_rows=True, classes=None,
 escape=True, notebook=False, border=None,
 table_id=None, render_links=False)
This function has several parameters, all of which are optional, allowing you to customize the resulting HTML output:
buf– This specifies the buffer where the HTML content will be written into. If no buffer is specified, the function will return the HTML as a string.columns– Allows you to specify the columns you want to include in the HTML output. If not provided, all columns will be included.col_space– This sets the minimum width of each column in the table.header– If set to True, column headers will be included. By default, it’s set to True.index– Determines whether to include row indices in the output. By default, it’s set to True.na_rep– This is the string representation of NaN to use.formatters– Allows you to specify custom formatting rules.float_format– Format to use for floating point numbers.sparsify– Set to False to print every multiindex key at each row.index_names– If True, the names of the indices will be included in the HTML table.justify– The technique for justifying the column content.max_rowsandmax_cols– Limit the number of rows and columns displayed.show_dimensions– If True, the table’s dimensions (row and column count) are printed at the end of the table.decimal– Character recognized as decimal separator.bold_rows– If True, makes the row labels bold in the output.classes– CSS classes to apply to the resulting HTML table.escape– If set to False, certain characters will not be escaped in the HTML output.notebook– If True, it will generate the table in the notebook’s visual context.border– Sets the border around the table.table_id– Adds an id attribute to the table. Useful for CSS styling.render_links– If True, any links will be rendered as HTML links in the output.
Convert Pandas DataFrame to HTML table
Let’s start by creating a DataFrame that contains columns of different types:
import pandas as pd
data = {
    'Names': ['Alice', 'Bob', 'Charlie'],
    'Score': [95.123, 86.456, 78.789],
    'Height': [1.68, 1.82, 1.75],
    'Website': ['https://alice.com', 'https://bob.com', 'https://charlie.com'],
    'Bio': ['<b>Alice is a data scientist.</b>', '<em>Bob is a software engineer.</em>', '<u>Charlie is a web developer.</u>']
}
df = pd.DataFrame(data)
df.to_html('output.html')
In this example, we first create a DataFrame from our dictionary using pd.DataFrame().
Then, we convert our DataFrame to an HTML table using the to_html() function.
Output:
| Names | Score | Height | Website | Bio | |
|---|---|---|---|---|---|
| 0 | Alice | 95.123 | 1.68 | https://alice.com | <b>Alice is a data scientist.</b> |
| 1 | Bob | 86.456 | 1.82 | https://bob.com | <em>Bob is a software engineer.</em> |
| 2 | Charlie | 78.789 | 1.75 | https://charlie.com | <u>Charlie is a web developer.</u> |
The Bio column is rendered as plain text, but we want to render it as HTML, how?
Disable HTML Escaping
By default, the HTML characters in the output are escaped for security concerns, and we need to disable this because we know what’s in the columns and we trust its content.
This can be done by setting the escape parameter to False.
df.to_html('output.html', escape=False)
Output:
| Names | Score | Height | Website | Bio | |
|---|---|---|---|---|---|
| 0 | Alice | 95.123 | 1.68 | https://alice.com | Alice is a data scientist. |
| 1 | Bob | 86.456 | 1.82 | https://bob.com | Bob is a software engineer. |
| 2 | Charlie | 78.789 | 1.75 | https://charlie.com | Charlie is a web developer. |
The output is rendered without escaping the HTML characters.
Choosing Columns
You can render only a subset of your DataFrame’s columns in the HTML output by passing a list of column names to the columns parameter in the to_html function.
Let’s take our earlier DataFrame and render only the ‘Names’ and ‘Score’ columns:
df.to_html('output.html', columns=['Names', 'Score'])
The output HTML string will now contain only the ‘Names’ and ‘Score’ columns from our DataFrame:
| Names | Score | |
|---|---|---|
| 0 | Alice | 95.123 |
| 1 | Bob | 86.456 |
| 2 | Charlie | 78.789 |
Limiting Rows and Columns
You can limit the number of rows and columns displayed using the max_rows and max_cols parameters respectively.
Let’s limit the number of rows in our HTML output to 2:
df.to_html('output.html', max_rows=2)
The resulting HTML table will only contain 2 rows of our DataFrame:
| Names | Score | Height | Website | Bio | |
|---|---|---|---|---|---|
| 0 | Alice | 95.123 | 1.68 | https://alice.com | <b>Alice is a data scientist.</b> |
| … | … | … | … | … | … |
| 2 | Charlie | 78.789 | 1.75 | https://charlie.com | <u>Charlie is a web developer.</u> |
Similarly, you can limit the number of columns displayed. Here’s how you can limit the output to the first two columns:
df.to_html('output.html', max_cols=2)
Output:
| Names | … | Bio | |
|---|---|---|---|
| 0 | Alice | … | <b>Alice is a data scientist.</b> |
| 1 | Bob | … | <em>Bob is a software engineer.</em> |
| 2 | Charlie | … | <u>Charlie is a web developer.</u> |
Customizing Headers and Indexes
You can exclude headers and indexes from the rendered HTML using the header and index parameters.
Exclude Column Headers
Let’s create an HTML table without column headers:
df.to_html('output.html', header=False)
The resulting HTML table will exclude the column headers:
| 0 | Alice | 95.123 | 1.68 | https://alice.com | <b>Alice is a data scientist.</b> |
|---|---|---|---|---|---|
| 1 | Bob | 86.456 | 1.82 | https://bob.com | <em>Bob is a software engineer.</em> |
| 2 | Charlie | 78.789 | 1.75 | https://charlie.com | <u>Charlie is a web developer.</u> |
Exclude Row Indices
You can exclude row indices in a similar manner:
df.to_html('output.html', index=False)
The resulting HTML table will exclude the row indices:
| Names | Score | Height | Website | Bio |
|---|---|---|---|---|
| Alice | 95.123 | 1.68 | https://alice.com | <b>Alice is a data scientist.</b> |
| Bob | 86.456 | 1.82 | https://bob.com | <em>Bob is a software engineer.</em> |
| Charlie | 78.789 | 1.75 | https://charlie.com | <u>Charlie is a web developer.</u> |
Column Formatters
The formatters parameter allows you to apply formatting rules to your DataFrame’s columns.
It accepts a dictionary where the keys are the column names, and the values are functions that take a single argument and return a formatted string:
# Define formatter
def format_score(x):
    return "{:.2f}".format(x)

df.to_html('output.html', formatters={'Score': format_score})
The resulting HTML table will have the ‘Score’ values rounded to 2 decimal places:
| Names | Score | Height | Website | Bio | |
|---|---|---|---|---|---|
| 0 | Alice | 95.12 | 1.68 | https://alice.com | <b>Alice is a data scientist.</b> |
| 1 | Bob | 86.46 | 1.82 | https://bob.com | <em>Bob is a software engineer.</em> |
| 2 | Charlie | 78.79 | 1.75 | https://charlie.com | <u>Charlie is a web developer.</u> |
Decimal Separator
In many European countries, a comma is used as the decimal separator instead of a period.
You can use the decimal parameter in the to_html function to specify a string to use as the decimal separator:
df.to_html('output.html', decimal=',')
The resulting HTML table will use a comma as the decimal separator in the ‘Score’ and ‘Height’ columns:
| Names | Score | Height | Website | Bio | |
|---|---|---|---|---|---|
| 0 | Alice | 95,123 | 1,68 | https://alice.com | <b>Alice is a data scientist.</b> |
| 1 | Bob | 86,456 | 1,82 | https://bob.com | <em>Bob is a software engineer.</em> |
| 2 | Charlie | 78,789 | 1,75 | https://charlie.com | <u>Charlie is a web developer.</u> |
Floating Point Format
The float_format parameter allows you to format floating point numbers in the output table.
For instance, let’s format the ‘Score’ and ‘Height’ columns such that all floating-point numbers are displayed with only one decimal place:
df.to_html('output.html', float_format="{:,.1f}".format)
The output HTML table now represents all floats with just one decimal place:
| Names | Score | Height | Website | Bio | |
|---|---|---|---|---|---|
| 0 | Alice | 95.1 | 1.7 | https://alice.com | <b>Alice is a data scientist.</b> |
| 1 | Bob | 86.5 | 1.8 | https://bob.com | <em>Bob is a software engineer.</em> |
| 2 | Charlie | 78.8 | 1.8 | https://charlie.com | <u>Charlie is a web developer.</u> |
Showing Dimensions
You can use the show_dimensions parameter to show the dimensions of your DataFrame (number of rows and columns) in the output HTML.
The show_dimensions parameter accepts either True, False or ‘truncate’. If it’s set to ‘truncate’, dimensions are printed only when the DataFrame is truncated.
df.to_html('output.html', show_dimensions=True)
The resulting HTML table includes the dimensions of the DataFrame:
| Names | Score | Height | Website | Bio | |
|---|---|---|---|---|---|
| 0 | Alice | 95.123 | 1.68 | https://alice.com | <b>Alice is a data scientist.</b> |
| 1 | Bob | 86.456 | 1.82 | https://bob.com | <em>Bob is a software engineer.</em> |
| 2 | Charlie | 78.789 | 1.75 | https://charlie.com | <u>Charlie is a web developer.</u> |
3 rows × 5 columns
Rendering Links
When your DataFrame contains URLs, it’s often desirable to render them as clickable hyperlinks in your output HTML.
You can achieve this by using the render_links parameter.
When render_links is set to True, any strings that are valid URLs will be rendered as HTML links in the output.
df.to_html('output.html', render_links=True)
The resulting HTML table will include clickable links, converting the links to anchor tags:
<table border="1" class="dataframe">
  <thead>
    <tr style="text-align: right;">
      <th></th>
      <th>Names</th>
      <th>Score</th>
      <th>Height</th>
      <th>Website</th>
      <th>Bio</th>
    </tr>
  </thead>
  <tbody>
    <tr>
      <th>0</th>
      <td>Alice</td>
      <td>95.123</td>
      <td>1.68</td>
      <td><a href="https://alice.com">https://alice.com</a></td>
      <td><b>Alice is a data scientist.</b></td>
    </tr>
    <tr>
      <th>1</th>
      <td>Bob</td>
      <td>86.456</td>
      <td>1.82</td>
      <td><a href="https://bob.com">https://bob.com</a></td>
      <td><em>Bob is a software engineer.</em></td>
    </tr>
    <tr>
      <th>2</th>
      <td>Charlie</td>
      <td>78.789</td>
      <td>1.75</td>
      <td><a href="https://charlie.com">https://charlie.com</a></td>
      <td><u>Charlie is a web developer.</u></td>
    </tr>
  </tbody>
</table>
Column Spacing
To control the spacing between the columns of your HTML table, you can use the col_space parameter.
This parameter accepts an integer or a string representing the desired column width. The width is applied to all columns.
Let’s create an HTML table with a column spacing of 200 pixels:
df.to_html('output.html', col_space=200)
The output HTML table will include the specified column spacing:
<table border="1" class="dataframe">
  <thead>
    <tr style="text-align: right;">
      <th style="min-width: 200px;"></th>
      <th style="min-width: 200px;">Names</th>
      <th style="min-width: 200px;">Score</th>
      <th style="min-width: 200px;">Height</th>
      <th style="min-width: 200px;">Website</th>
      <th style="min-width: 200px;">Bio</th>
    </tr>
  </thead>
  <tbody>
    <tr>
      <th style="min-width: 200px;">0</th>
      <td style="min-width: 200px;">Alice</td>
      <td style="min-width: 200px;">95.123</td>
      <td style="min-width: 200px;">1.68</td>
      <td style="min-width: 200px;">https://alice.com</td>
      <td style="min-width: 200px;"><b>Alice is a data scientist.</b></td>
    </tr>
    <tr>
      <th style="min-width: 200px;">1</th>
      <td style="min-width: 200px;">Bob</td>
      <td style="min-width: 200px;">86.456</td>
      <td style="min-width: 200px;">1.82</td>
      <td style="min-width: 200px;">https://bob.com</td>
      <td style="min-width: 200px;"><em>Bob is a software engineer.</em></td>
    </tr>
    <tr>
      <th style="min-width: 200px;">2</th>
      <td style="min-width: 200px;">Charlie</td>
      <td style="min-width: 200px;">78.789</td>
      <td style="min-width: 200px;">1.75</td>
      <td style="min-width: 200px;">https://charlie.com</td>
      <td style="min-width: 200px;"><u>Charlie is a web developer.</u></td>
    </tr>
  </tbody>
</table>
Control Index Label Thickness
By default, Pandas makes index labels bold, but you can disable this by setting the bold_rows parameter to False:
df.to_html('output.html', bold_rows=False)
The resulting HTML table has index labels not bolded:
| Names | Score | Height | Website | Bio | |
|---|---|---|---|---|---|
| 0 | Alice | 95.123 | 1.68 | https://alice.com | <b>Alice is a data scientist.</b> |
| 1 | Bob | 86.456 | 1.82 | https://bob.com | <em>Bob is a software engineer.</em> |
| 2 | Charlie | 78.789 | 1.75 | https://charlie.com | <u>Charlie is a web developer.</u> |
HTML Class Specification
When generating your HTML table, you might want to include CSS classes for custom styling.
You can achieve this by using the classes parameter of the to_html function.
It accepts either a string or a list of strings representing the CSS class names.
Let’s create an HTML table with a class called ‘my-table’:
df.to_html('output.html', classes="my-table")
The resulting HTML table will include the specified class:
<table border="1" class="dataframe my-table">
  <thead>
...
...
Setting Table ID
The table_id parameter of the to_html function allows you to assign a specific ID to your table.
Let’s create an HTML table with an ID ‘my_table’:
df.to_html('output.html', table_id="my_table")
The resulting HTML table will include the specified ID:
<table border="1" class="dataframe" id="my_table">
  <thead>
...
...
Setting Borders
If you want to adjust the border of your HTML table, you can use the border parameter of the to_html function.
It allows you to set the border-width of your table.
Let’s create an HTML table with a border-width of 2:
df.to_html('output.html', border=2)
The resulting HTML table will include the specified border:
<table border="2" class="dataframe">
  <thead>
...
...
Setting Header Alignment
The justify parameter of the to_html function allows you to control the alignment of the table header cells. It accepts the values ‘left’, ‘right’, and ‘center’.
Let’s create an HTML table with centered column labels:
df.to_html('output.html', justify='center')
The resulting HTML table will have a table header with center-aligned cells:
| Names | Score | Height | Website | Bio | |
|---|---|---|---|---|---|
| 0 | Alice | 95.123 | 1.68 | https://alice.com | <b>Alice is a data scientist.</b> |
| 1 | Bob | 86.456 | 1.82 | https://bob.com | <em>Bob is a software engineer.</em> |
| 2 | Charlie | 78.789 | 1.75 | https://charlie.com | <u>Charlie is a web developer.</u> |
Jupyter Notebook Integration
If you’re working in a Jupyter Notebook, you might want your HTML tables to integrate seamlessly with the notebook’s style.
You can achieve this by calling the display method from IPython.display
df.to_html()
display(df)
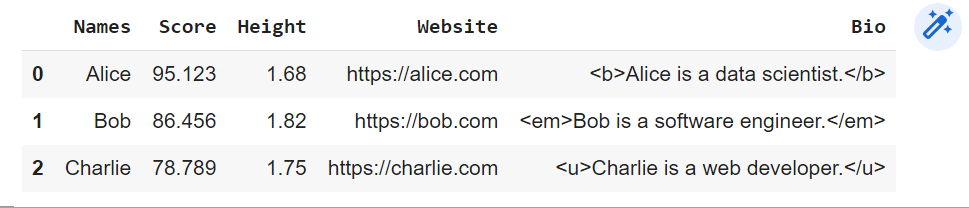
The resulting HTML table will look great within your Jupyter Notebook:
Further Reading
https://pandas.pydata.org/docs/reference/api/pandas.DataFrame.to_html.html
Mokhtar is the founder of LikeGeeks.com. He is a seasoned technologist and accomplished author, with expertise in Linux system administration and Python development. Since 2010, Mokhtar has built an impressive career, transitioning from system administration to Python development in 2015. His work spans large corporations to freelance clients around the globe. Alongside his technical work, Mokhtar has authored some insightful books in his field. Known for his innovative solutions, meticulous attention to detail, and high-quality work, Mokhtar continually seeks new challenges within the dynamic field of technology.