How to Create Dynamic Titles in Python Matplotlib 3D Plots
This tutorial will guide you through various methods to create dynamic titles for your 3D plots using Matplotlib.
Using Time Update
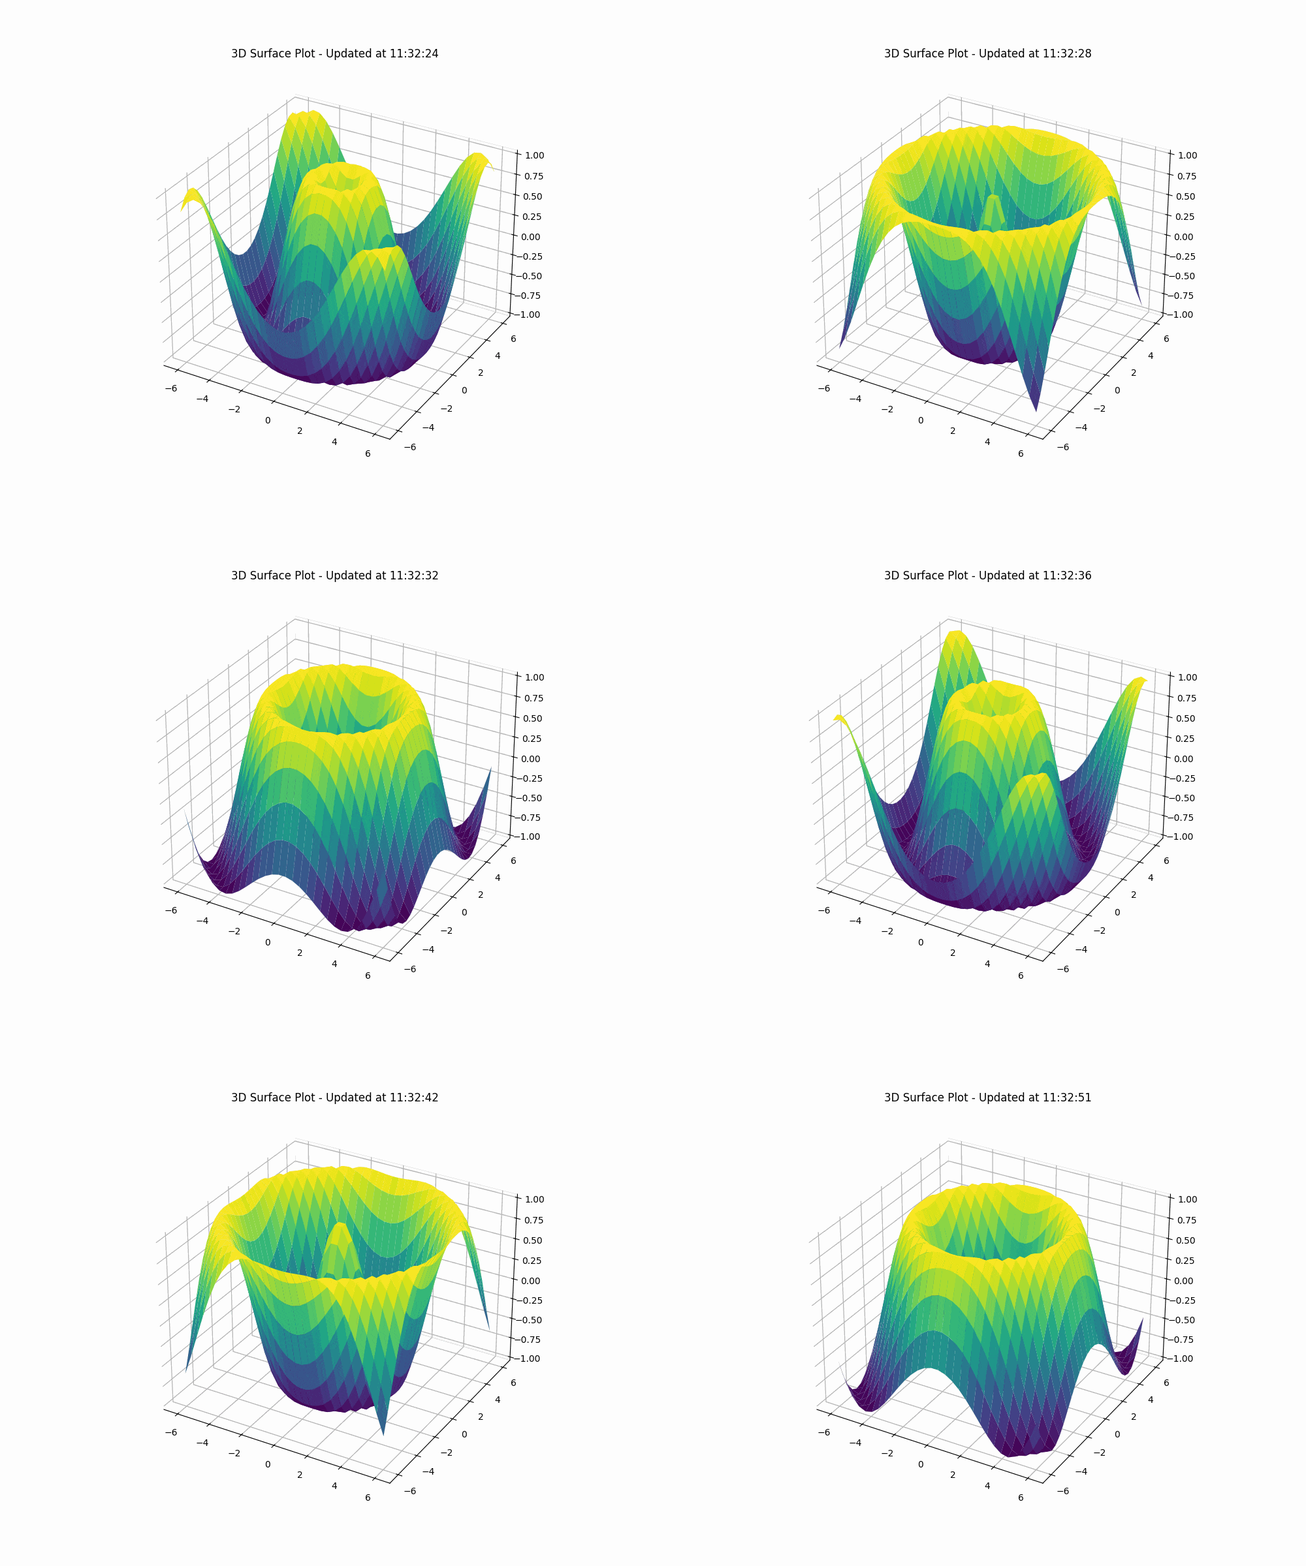
To create a 3D plot with a dynamic title that updates with time, you can use Matplotlib animation functionality:
import matplotlib.pyplot as plt
import numpy as np
from matplotlib.animation import FuncAnimation
from mpl_toolkits.mplot3d import Axes3D
import time
def update(frame):
    ax.clear()
    X, Y = np.meshgrid(x, y)
    Z = np.sin(np.sqrt(X**2 + Y**2) + frame/10)
    surf = ax.plot_surface(X, Y, Z, cmap='viridis')
    current_time = time.strftime("%H:%M:%S")
    ax.set_title(f"3D Surface Plot - Updated at {current_time}")
    return surf,
fig = plt.figure(figsize=(10, 8))
ax = fig.add_subplot(111, projection='3d')
x = np.linspace(-6, 6, 30)
y = np.linspace(-6, 6, 30)
ani = FuncAnimation(fig, update, frames=100, interval=200, blit=False)
plt.show()
Output:
This code creates a 3D surface plot with a dynamic title that updates with the current time.
The plot shows a sine wave that changes over time, and the title reflects the exact time of each update.
Using User Input
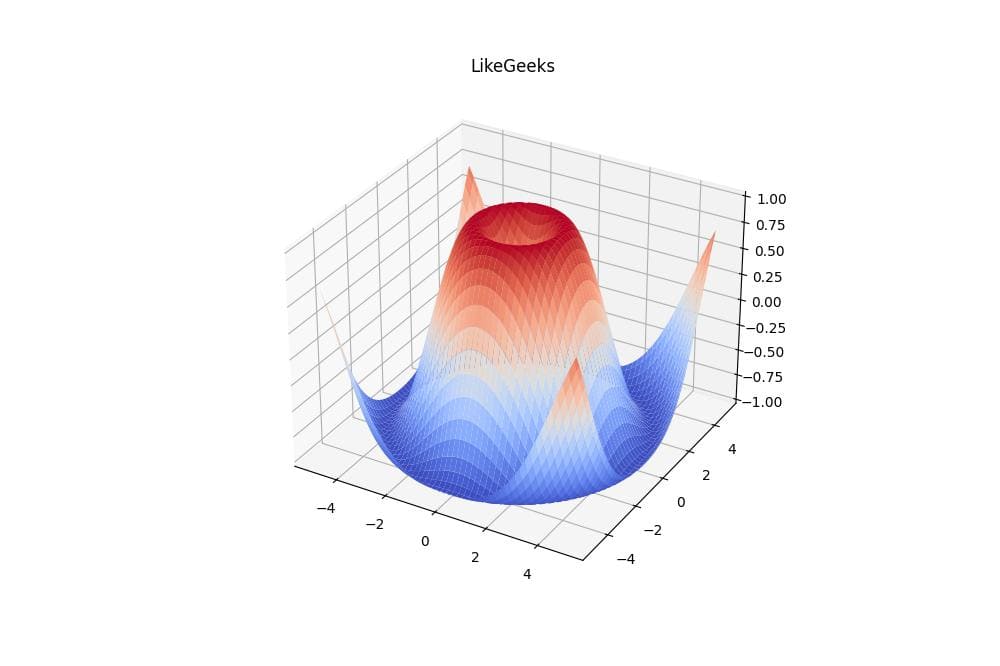
You can create a 3D plot where the title updates based on user input:
import matplotlib.pyplot as plt
import numpy as np
from mpl_toolkits.mplot3d import Axes3D
def plot_3d(title):
    fig = plt.figure(figsize=(10, 8))
    ax = fig.add_subplot(111, projection='3d')
    x = np.linspace(-5, 5, 100)
    y = np.linspace(-5, 5, 100)
    X, Y = np.meshgrid(x, y)
    Z = np.sin(np.sqrt(X**2 + Y**2))
    surf = ax.plot_surface(X, Y, Z, cmap='coolwarm')
    ax.set_title(title)
    plt.show()
user_title = input("Enter a title for the 3D plot: ")
plot_3d(user_title)
Output:
This script prompts the user to enter a title, then creates a 3D surface plot with the user-provided title.
Dynamic Title with Parameter Variation
To create a 3D plot with a title that updates based on parameter changes:
import matplotlib.pyplot as plt
import numpy as np
from mpl_toolkits.mplot3d import Axes3D
def plot_3d_gaussian(mu_x, mu_y, sigma):
    fig = plt.figure(figsize=(10, 8))
    ax = fig.add_subplot(111, projection='3d')
    x = np.linspace(-10, 10, 100)
    y = np.linspace(-10, 10, 100)
    X, Y = np.meshgrid(x, y)
    Z = np.exp(-((X - mu_x)**2 + (Y - mu_y)**2) / (2 * sigma**2))
    surf = ax.plot_surface(X, Y, Z, cmap='viridis')
    ax.set_title(f"3D Gaussian (μx={mu_x}, μy={mu_y}, σ={sigma})")
    plt.show()
plot_3d_gaussian(0, 0, 2)
plot_3d_gaussian(2, -1, 1.5)
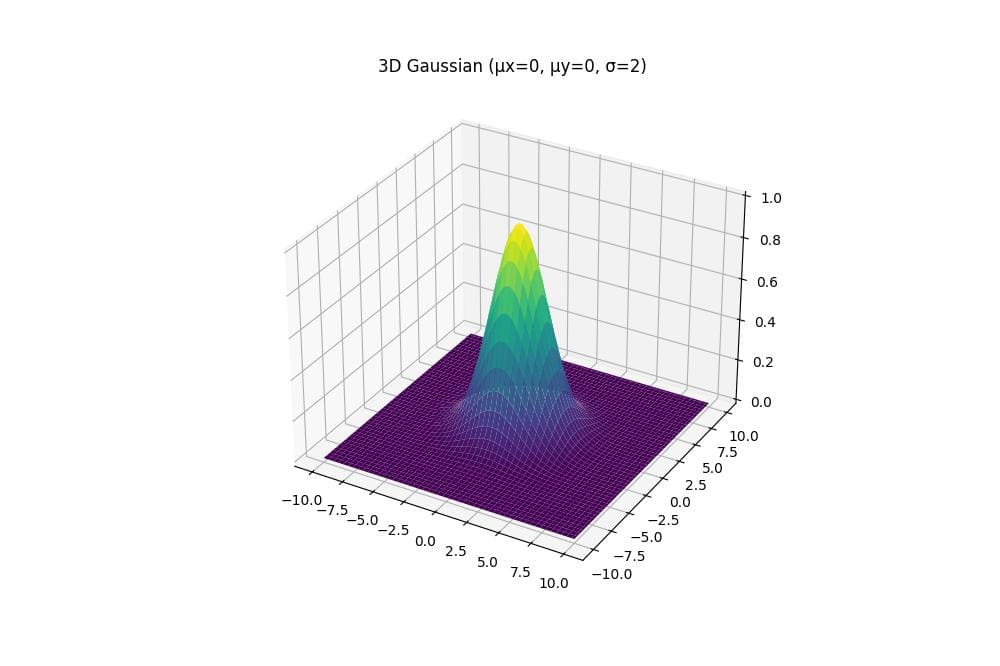
Output (First plot):
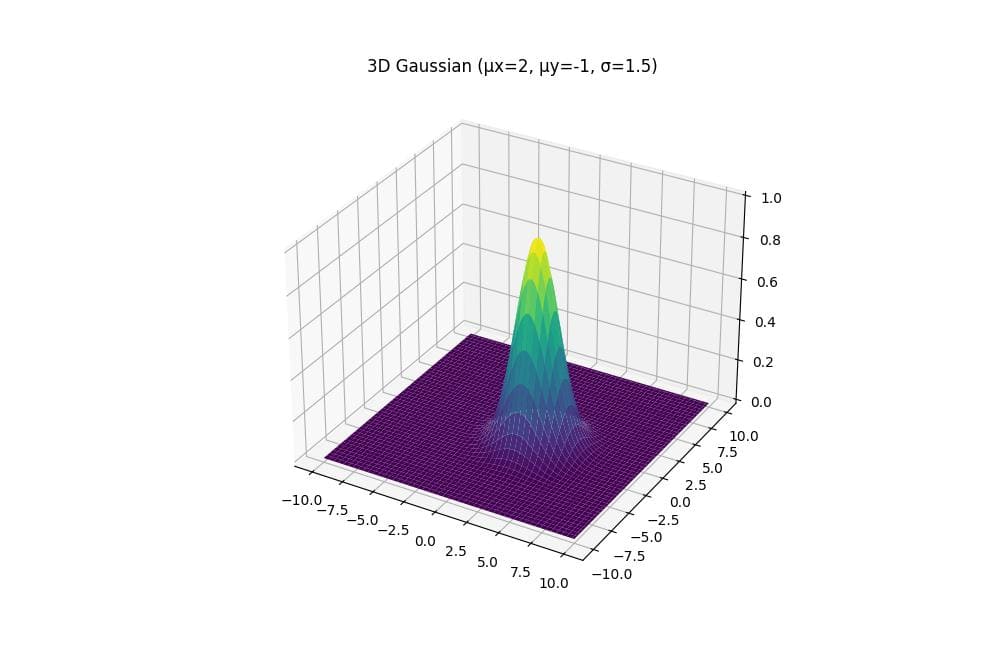
Output (Second plot):
This code generates two 3D Gaussian distribution plots with different parameters.
The title of each plot dynamically reflects the current parameter values (mean in x and y directions, and standard deviation).
Mokhtar is the founder of LikeGeeks.com. He is a seasoned technologist and accomplished author, with expertise in Linux system administration and Python development. Since 2010, Mokhtar has built an impressive career, transitioning from system administration to Python development in 2015. His work spans large corporations to freelance clients around the globe. Alongside his technical work, Mokhtar has authored some insightful books in his field. Known for his innovative solutions, meticulous attention to detail, and high-quality work, Mokhtar continually seeks new challenges within the dynamic field of technology.


