Create Clickable Points in Python Matplotlib 3D Scatter Plot
In this tutorial, you’ll learn how to create interactive 3D scatter plots with clickable points using Python.
You’ll use libraries like Matplotlib to create interactive plots.
Display Information
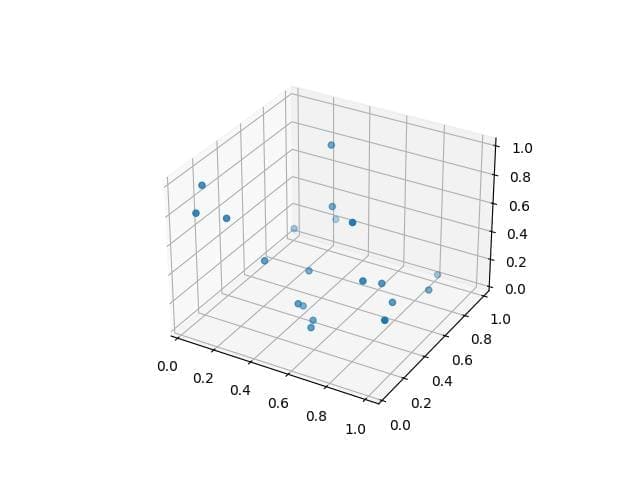
To make the plot interactive and show the coordinates of clicked points, you can use Matplotlib event handling:
import matplotlib.pyplot as plt
import numpy as np
from mpl_toolkits.mplot3d import Axes3D
x = np.random.rand(20)
y = np.random.rand(20)
z = np.random.rand(20)
fig = plt.figure()
ax = fig.add_subplot(111, projection='3d')
scatter = ax.scatter(x, y, z)

# Define a function to handle click events
def on_click(event):
  if event.inaxes == ax:
      cont, ind = scatter.contains(event)
      if cont:
          idx = ind['ind'][0]
          print(f"Clicked on point: {idx}")
          print(f"Coordinates: ({x[idx]:.2f}, {y[idx]:.2f}, {z[idx]:.2f})")
fig.canvas.mpl_connect('button_press_event', on_click)
plt.show()
Output:
Clicked on point: 6
Coordinates: (0.75, 0.29, 0.85)
Clicked on point: 1
Coordinates: (0.39, 0.71, 0.98)
Clicked on point: 7
Coordinates: (1.00, 0.14, 0.39)
When you run this code and click on a point in the plot, it will print the coordinates of the clicked point in the console.
Open External Resources
To open external resources when clicking on a point, you can modify the on_click function:
import numpy as np
import matplotlib.pyplot as plt
from mpl_toolkits.mplot3d import Axes3D
import webbrowser
import os
np.random.seed(42)
n_points = 100
x = np.random.rand(n_points)
y = np.random.rand(n_points)
z = np.random.rand(n_points)

# Create a list of URLs and file paths associated with each point
urls = [f"https://example.com/point/{i}" for i in range(n_points)]
fig = plt.figure(figsize=(10, 8))
ax = fig.add_subplot(111, projection='3d')
scatter = ax.scatter(x, y, z)
def on_click(event):
    if event.inaxes == ax:
        cont, ind = scatter.contains(event)
        if cont:
            index = ind["ind"][0]
            webbrowser.open(urls[index])
fig.canvas.mpl_connect('button_press_event', on_click)
plt.show()
This code opens a web page and a local file associated with the clicked point.
Make sure to replace the example URLs and file paths with your actual resources.
Visual Changes
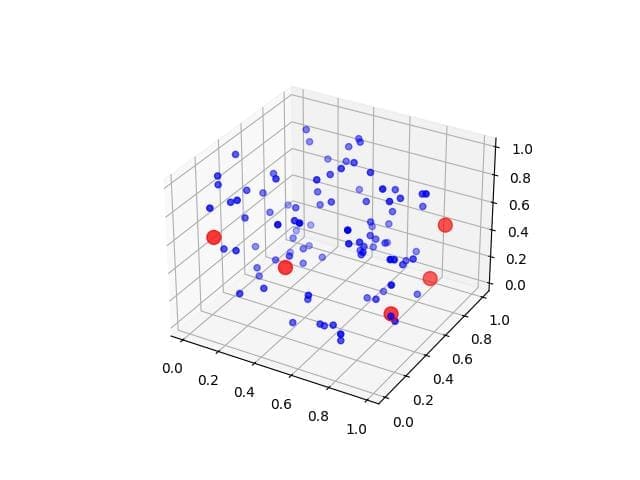
To change the visual properties of clicked points, you can modify the scatter plot data:
import matplotlib.pyplot as plt
from mpl_toolkits.mplot3d import Axes3D
import numpy as np
np.random.seed(0)
x = np.random.rand(100)
y = np.random.rand(100)
z = np.random.rand(100)
colors = np.array(['b'] * len(x))
sizes = np.array([20] * len(x))
fig = plt.figure()
ax = fig.add_subplot(111, projection='3d')
sc = ax.scatter(x, y, z, c=colors, s=sizes)
def onpick(event):
  ind = event.ind[0]  # Get the index of the clicked point
  colors[ind] = 'r'  # Change color to red
  sizes[ind] = 100   # Change size
  sc.set_facecolor(colors)
  sc.set_sizes(sizes)
  fig.canvas.draw()
fig.canvas.mpl_connect('pick_event', onpick)
sc.set_picker(True)
plt.show()
This code changes the color and size of the clicked point. The point turns red and becomes larger.
Load Images or Documents
To load images or documents associated with clicked points, you can use libraries like Pillow for images or PyPDF2 for PDF documents:
import numpy as np
import matplotlib.pyplot as plt
from mpl_toolkits.mplot3d import Axes3D
from PIL import Image
import io
np.random.seed(42)
n_points = 100
x = np.random.rand(n_points)
y = np.random.rand(n_points)
z = np.random.rand(n_points)

# Create sample images for each point
images = [Image.new('RGB', (100, 100), color=(np.random.randint(0, 256), np.random.randint(0, 256), np.random.randint(0, 256))) for _ in range(n_points)]
fig = plt.figure(figsize=(10, 8))
ax = fig.add_subplot(111, projection='3d')
scatter = ax.scatter(x, y, z)
def on_click(event):
    if event.inaxes == ax:
        cont, ind = scatter.contains(event)
        if cont:
            index = ind["ind"][0]
            img = images[index]
            img.show()  # This will open the image in the default image viewer
fig.canvas.mpl_connect('button_press_event', on_click)
plt.show()
Output:
This code creates a random color image for each point and displays it when the point is clicked.
Trigger a Callback Function
To trigger a custom callback function when a point is clicked, you can define the function and call it in the on_click event handler:
import numpy as np
import matplotlib.pyplot as plt
from mpl_toolkits.mplot3d import Axes3D
np.random.seed(42)
n_points = 100
x = np.random.rand(n_points)
y = np.random.rand(n_points)
z = np.random.rand(n_points)
fig = plt.figure(figsize=(10, 8))
ax = fig.add_subplot(111, projection='3d')
scatter = ax.scatter(x, y, z)
def custom_callback(x, y, z):
    print(f"Custom callback triggered for point ({x:.2f}, {y:.2f}, {z:.2f})")
    # Add your custom logic here
def on_click(event):
    if event.inaxes == ax:
        cont, ind = scatter.contains(event)
        if cont:
            index = ind["ind"][0]
            custom_callback(x[index], y[index], z[index])
fig.canvas.mpl_connect('button_press_event', on_click)
plt.show()
Output:
Custom callback triggered for point (0.76, 0.90, 0.82)
Custom callback triggered for point (0.83, 0.93, 0.65)
This code defines a custom_callback function that is called when a point is clicked.
You can modify this function to perform any custom action you need when a point is clicked.
Mokhtar is the founder of LikeGeeks.com. He is a seasoned technologist and accomplished author, with expertise in Linux system administration and Python development. Since 2010, Mokhtar has built an impressive career, transitioning from system administration to Python development in 2015. His work spans large corporations to freelance clients around the globe. Alongside his technical work, Mokhtar has authored some insightful books in his field. Known for his innovative solutions, meticulous attention to detail, and high-quality work, Mokhtar continually seeks new challenges within the dynamic field of technology.


