Set Axis Ranges in Python 3D Plots using Matplotlib
In this tutorial, you’ll learn how to set and customize axis ranges in Python 3D plots using Matplotlib.
You’ll explore various methods to adjust axis limits, and automate range selection for your 3D visualizations.
Using set_xlim, set_ylim, and set_zlim
To set axis ranges in 3D plots, you can use the set_xlim, set_ylim, and set_zlim methods.
Here’s how to apply them:
import matplotlib.pyplot as plt
import numpy as np
from mpl_toolkits.mplot3d import Axes3D
x = np.linspace(0, 10, 100)
y = np.sin(x)
z = np.cos(x)
fig = plt.figure(figsize=(10, 8))
ax = fig.add_subplot(111, projection='3d')
ax.plot(x, y, z)

# Set axis ranges
ax.set_xlim(0, 5)
ax.set_ylim(-1.5, 1.5)
ax.set_zlim(-1, 1)
plt.title("3D Plot with Custom Axis Ranges")
plt.show()
Output:
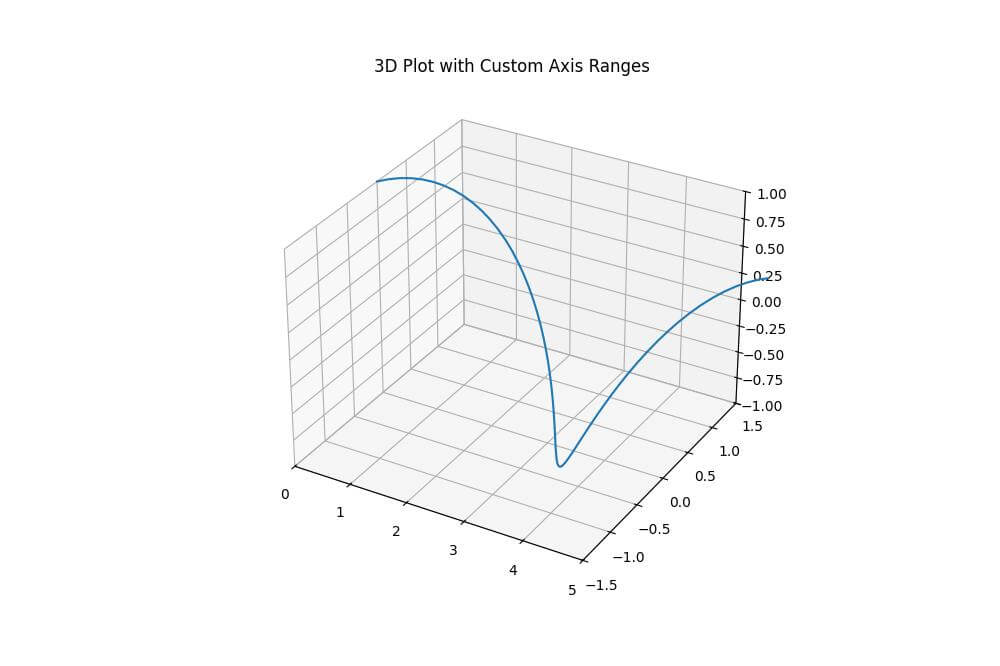
This code creates a 3D plot of sine and cosine functions, then sets custom ranges for each axis.
The x-axis is limited to [0, 5], the y-axis to [-1.5, 1.5], and the z-axis to [-1, 1].
This focuses the view on a specific portion of the data.
Customize Axis Range with set_xlim3d
You can use specialized methods such as set_xlim3d, set_ylim3d, and set_zlim3d to set custom ranges.
These methods offer more control over 3D axis properties:
import matplotlib.pyplot as plt
import numpy as np
from mpl_toolkits.mplot3d import Axes3D
theta = np.linspace(0, 2*np.pi, 100)
z = np.linspace(0, 5, 100)
r = z**1.5
x = r * np.sin(theta)
y = r * np.cos(theta)
fig = plt.figure(figsize=(10, 8))
ax = fig.add_subplot(111, projection='3d')
ax.plot(x, y, z)

# Customize axis ranges
ax.set_xlim3d(-5, 5)
ax.set_ylim3d(-5, 5)
ax.set_zlim3d(0, 6)
plt.title("3D Spiral with Customized Axis Ranges")
plt.show()
Output:
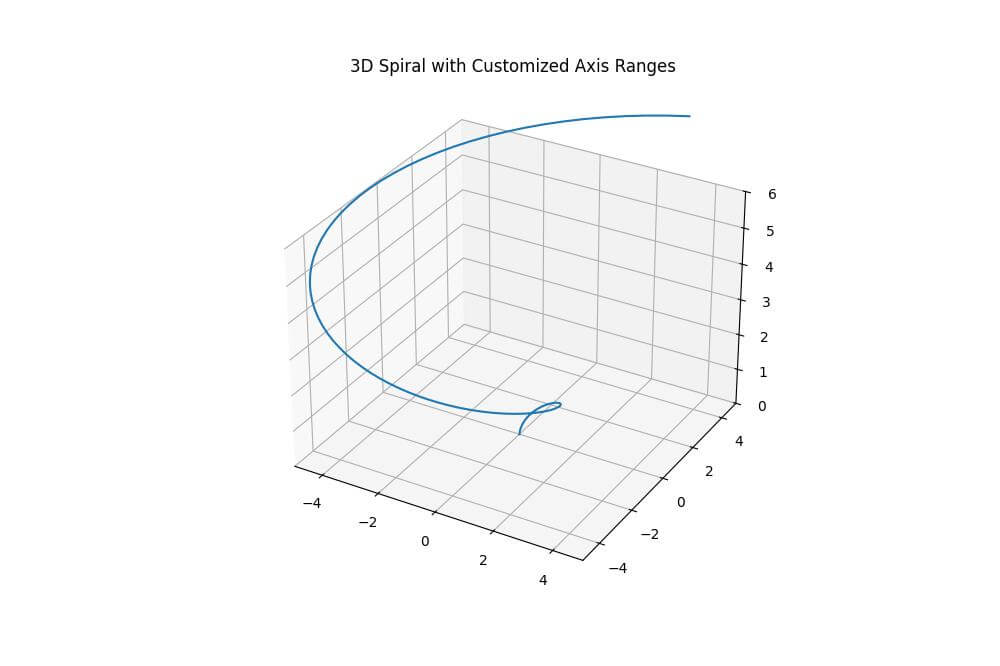
These methods are specifically designed for 3D plots and can handle additional 3D-specific parameters if needed.
Dynamic Axis Ranges
The autoscale_view method allows you to dynamically adjust axis ranges based on the data.
Here’s how to use it:
import matplotlib.pyplot as plt
import numpy as np
from mpl_toolkits.mplot3d import Axes3D
x = np.random.rand(100) * 10
y = np.random.rand(100) * 10
z = np.random.rand(100) * 10
fig = plt.figure(figsize=(15, 6))

# Without autoscale_view
ax1 = fig.add_subplot(121, projection='3d')
ax1.scatter(x, y, z)
ax1.set_title("Without autoscale_view")

# With autoscale_view
ax2 = fig.add_subplot(122, projection='3d')
ax2.scatter(x, y, z)
ax2.autoscale_view()
ax2.set_title("With autoscale_view")
plt.tight_layout()
plt.show()
Output:
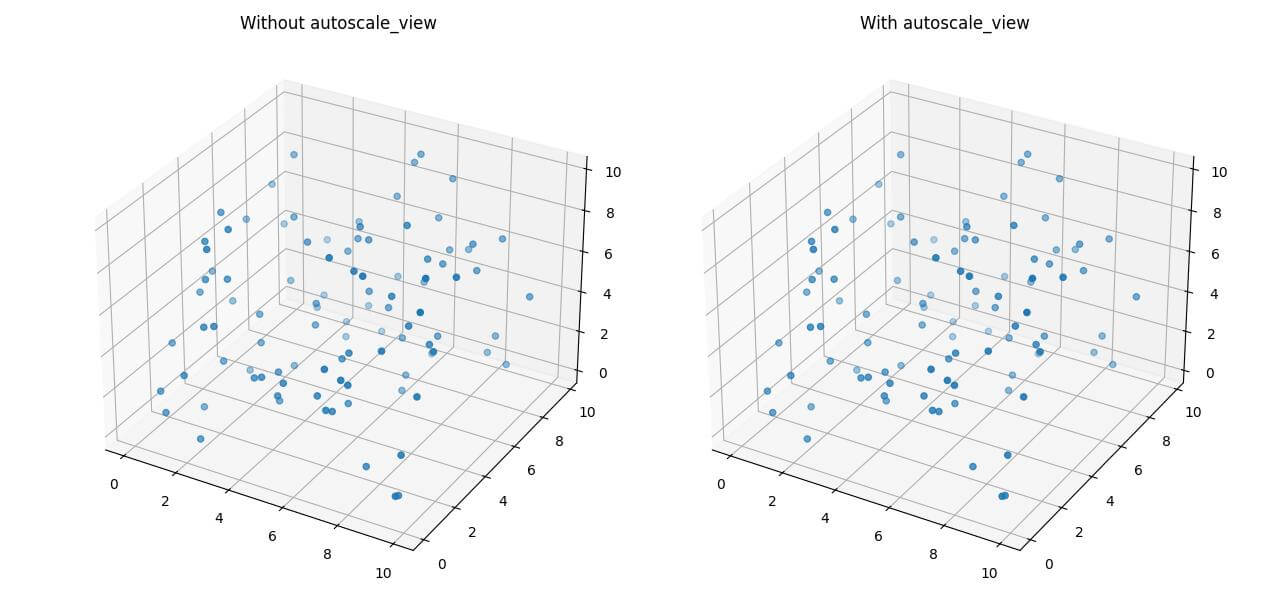
The autoscale_view method automatically adjusts the axis ranges to fit the data.
In this example, the right plot (ax2) uses autoscale_view and that makes axis ranges fit the scattered points.
Using ax.auto_scale_xyz for Automatic Scaling
The auto_scale_xyz method allows you to automatically scale all three axes:
import matplotlib.pyplot as plt
import numpy as np
from mpl_toolkits.mplot3d import Axes3D
x = np.random.rand(100) * 10
y = np.random.rand(100) * 100
z = np.random.rand(100) * 1000
fig = plt.figure(figsize=(15, 6))

# Without auto_scale_xyz
ax1 = fig.add_subplot(121, projection='3d')
ax1.scatter(x, y, z)
ax1.set_title("Without auto_scale_xyz")

# With auto_scale_xyz
ax2 = fig.add_subplot(122, projection='3d')
ax2.scatter(x, y, z)
ax2.auto_scale_xyz(x, y, z)
ax2.set_title("With auto_scale_xyz")
plt.tight_layout()
plt.show()
Output:
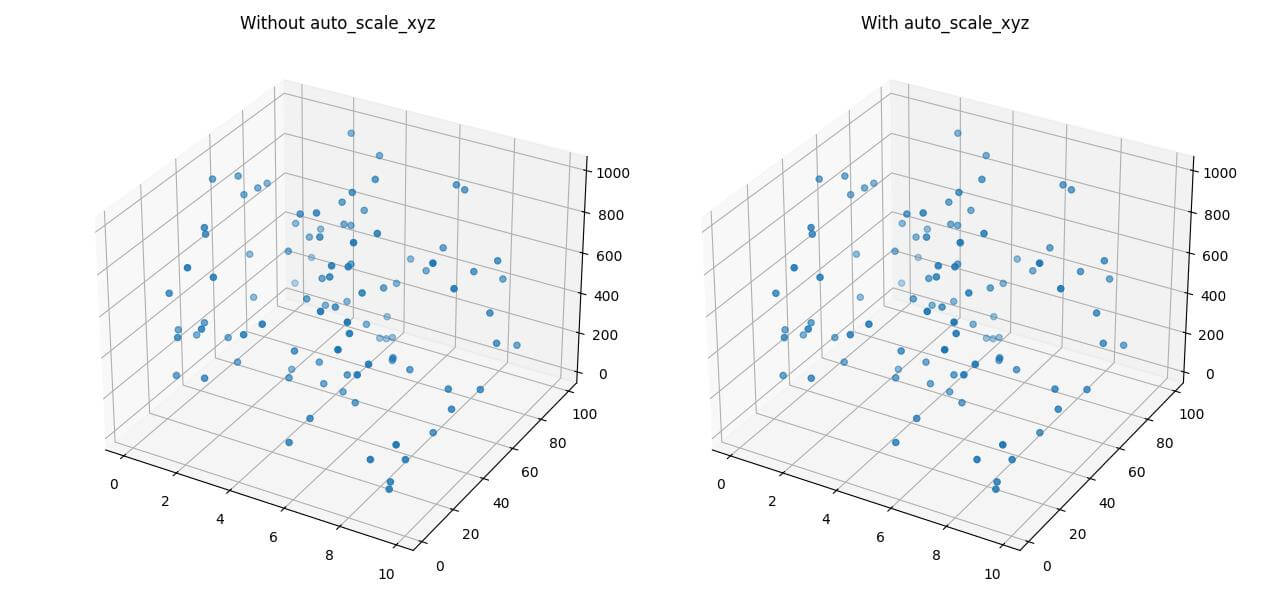
The auto_scale_xyz method automatically adjusts the scales of all three axes to fit the data.
This is useful when dealing with data that has significantly different ranges across dimensions.
Mokhtar is the founder of LikeGeeks.com. He is a seasoned technologist and accomplished author, with expertise in Linux system administration and Python development. Since 2010, Mokhtar has built an impressive career, transitioning from system administration to Python development in 2015. His work spans large corporations to freelance clients around the globe. Alongside his technical work, Mokhtar has authored some insightful books in his field. Known for his innovative solutions, meticulous attention to detail, and high-quality work, Mokhtar continually seeks new challenges within the dynamic field of technology.