How to Shade Area Conditionally in Python Matplotlib 3D Plot
In this tutorial, you’ll learn how to conditionally shade areas in a 3D plot in Python.
This method is useful for visualizing data where certain regions need to be highlighted based on specific criteria.
To create a 3D plot, you can use the Axes3D class from Matplotlib. This class allows you to generate 3D plots and customize them.
import matplotlib.pyplot as plt
from mpl_toolkits.mplot3d import Axes3D
import numpy as np
x = np.linspace(-5, 5, 100)
y = np.linspace(-5, 5, 100)
x, y = np.meshgrid(x, y)
z = np.sin(np.sqrt(x**2 + y**2))
fig = plt.figure()
ax = fig.add_subplot(111, projection='3d')
ax.plot_surface(x, y, z, cmap='viridis')
plt.show()
Output:
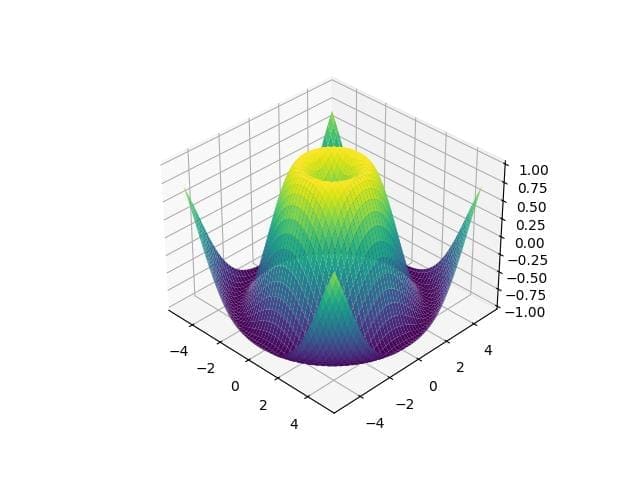
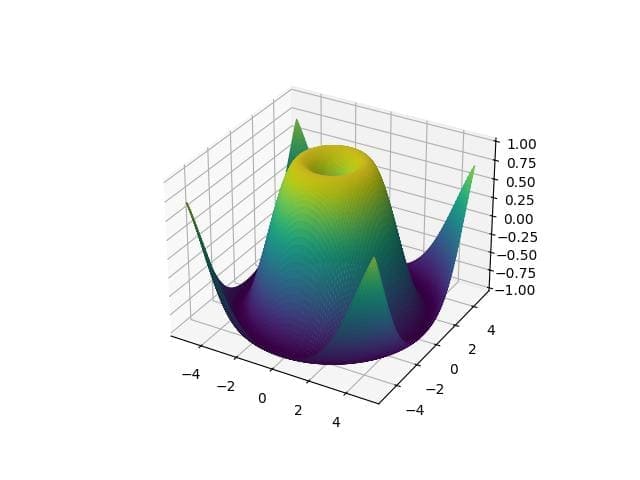
The plot displays a 3D surface of the sine function over a grid.
Threshold-based conditions
Shading based on Z-value
You can shade areas in a 3D plot based on a threshold Z-value using conditional logic.
threshold = 0.5

# Create a mask for shading
z_mask = np.where(z > threshold, z, np.nan)

# Plot with shading
fig = plt.figure()
ax = fig.add_subplot(111, projection='3d')
ax.plot_surface(x, y, z, cmap='viridis', alpha=0.5)
ax.plot_surface(x, y, z_mask, color='red', alpha=0.9)
plt.show()
Output:
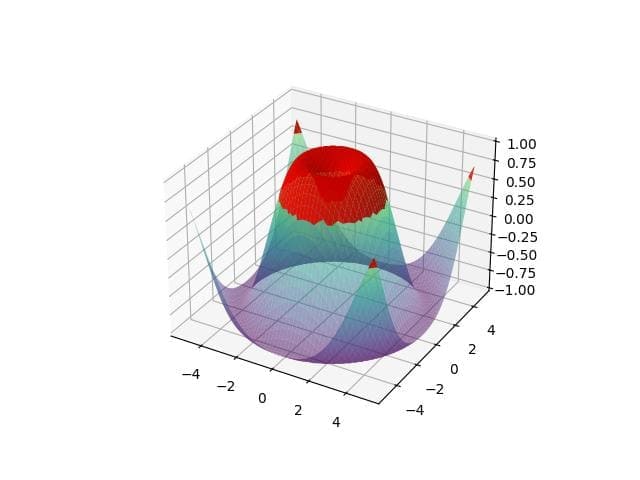
The plot shows the original surface with a semi-transparent overlay where the Z-values exceed the threshold. The red shading highlights these areas.
Shading Based on Distance From a Point
To shade based on distance from a specific point, calculate the distance and apply a condition.
# Define a point
point = np.array([0, 0])

# Calculate distance from the point
distance = np.sqrt((x - point[0])**2 + (y - point[1])**2)

# Define a distance threshold
distance_threshold = 4

# Create a mask for shading
distance_mask = np.where(distance < distance_threshold, z, np.nan)
fig = plt.figure()
ax = fig.add_subplot(111, projection='3d')
ax.plot_surface(x, y, z, cmap='viridis', alpha=0.5)
ax.plot_surface(x, y, distance_mask, color='red', alpha=0.9)
plt.show()
Output:
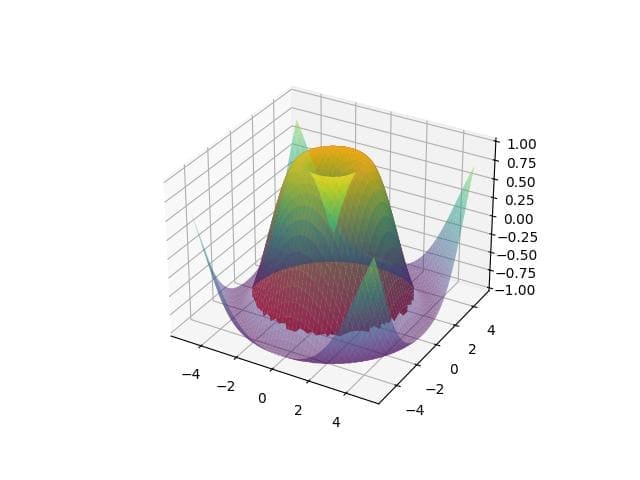
The plot highlights areas within a specified distance from the origin. The blue shading indicates regions closer than the defined threshold.
Multiple Condition Handling
To handle multiple conditions, combine logical operations to create complex masks.
# Define multiple conditions
condition1 = z > 0.5
condition2 = distance < 3
combined_mask = np.where(condition1 & condition2, z, np.nan)
fig = plt.figure()
ax = fig.add_subplot(111, projection='3d')
ax.plot_surface(x, y, z, cmap='viridis', alpha=0.2)
ax.plot_surface(x, y, combined_mask, color='red', alpha=0.9)
plt.show()
Output:
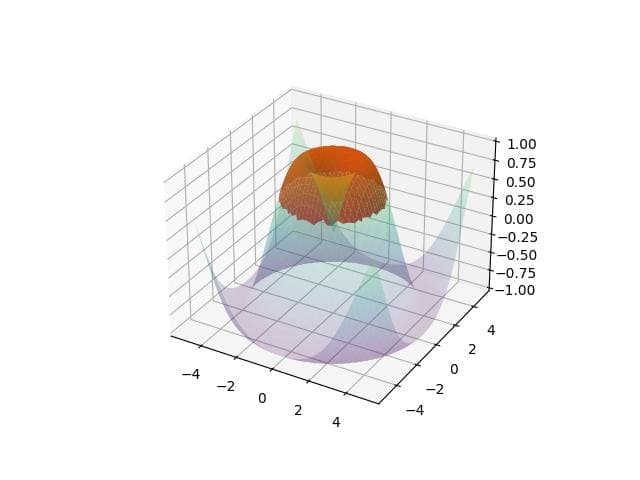
The plot shows areas where both conditions are met.
The purple shading highlights regions where the Z-value is above 0.5 and within the distance threshold.
Shading Multiple Regions
You can apply separate masks for each condition to shade multiple regions with distinct criteria.
# Define another condition
condition3 = z < -0.5

# Create masks for each region
mask1 = np.where(condition1, z, np.nan)
mask2 = np.where(condition3, z, np.nan)
fig = plt.figure()
ax = fig.add_subplot(111, projection='3d')
ax.plot_surface(x, y, z, cmap='viridis', alpha=0.2)
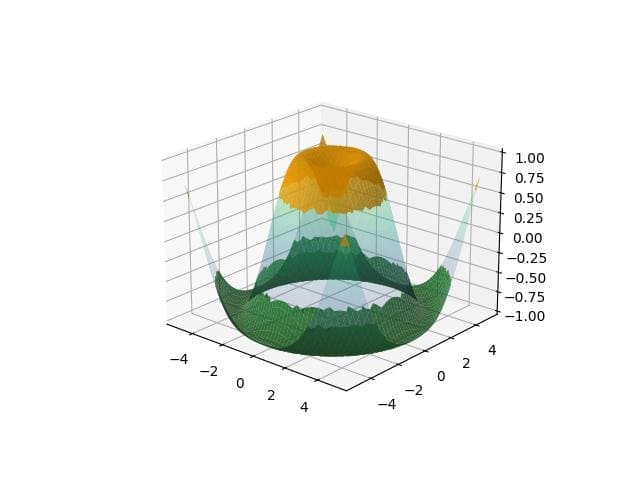
ax.plot_surface(x, y, mask1, color='orange', alpha=0.8)
ax.plot_surface(x, y, mask2, color='green', alpha=0.8)
plt.show()
Output:
The plot displays multiple shaded regions: orange for Z-values above 0.5 and green for Z-values below -0.5.
Gradient Shading Based on Data Values
To apply gradient shading based on data values, use a colormap to represent the range of values.
# Normalize the Z-values for gradient shading
norm = plt.Normalize(z.min(), z.max())
fig = plt.figure()
ax = fig.add_subplot(111, projection='3d')
ax.plot_surface(x, y, z, facecolors=plt.cm.viridis(norm(z)), rstride=1, cstride=1, alpha=0.9)
plt.show()
Output:
The plot uses a gradient to represent the Z-values, with colors smoothly transitioning according to the data range.
Mokhtar is the founder of LikeGeeks.com. He is a seasoned technologist and accomplished author, with expertise in Linux system administration and Python development. Since 2010, Mokhtar has built an impressive career, transitioning from system administration to Python development in 2015. His work spans large corporations to freelance clients around the globe. Alongside his technical work, Mokhtar has authored some insightful books in his field. Known for his innovative solutions, meticulous attention to detail, and high-quality work, Mokhtar continually seeks new challenges within the dynamic field of technology.

