3D Plot Rotation Methods in Python using Matplotlib
In this tutorial, you’ll learn various methods to rotate 3D plots in Python using Matplotlib.
Rotate Around the X-Axis
To rotate a 3D plot around the X-axis, you’ll use Matplotlib view_init() function.
This function allows you to set the elevation and azimuth angles of the plot.
Here’s how you can create a simple 3D surface plot and rotate it around the X-axis:
import numpy as np
import matplotlib.pyplot as plt
from mpl_toolkits.mplot3d import Axes3D
x = np.linspace(-5, 5, 50)
y = np.linspace(-5, 5, 50)
X, Y = np.meshgrid(x, y)
Z = np.sin(np.sqrt(X**2 + Y**2))
fig = plt.figure(figsize=(10, 7))
ax = fig.add_subplot(111, projection='3d')
surf = ax.plot_surface(X, Y, Z, cmap='viridis')

# Rotate around X-axis
ax.view_init(elev=20, azim=45)
plt.title("3D Surface Plot Rotated Around X-Axis")
plt.show()
Output:
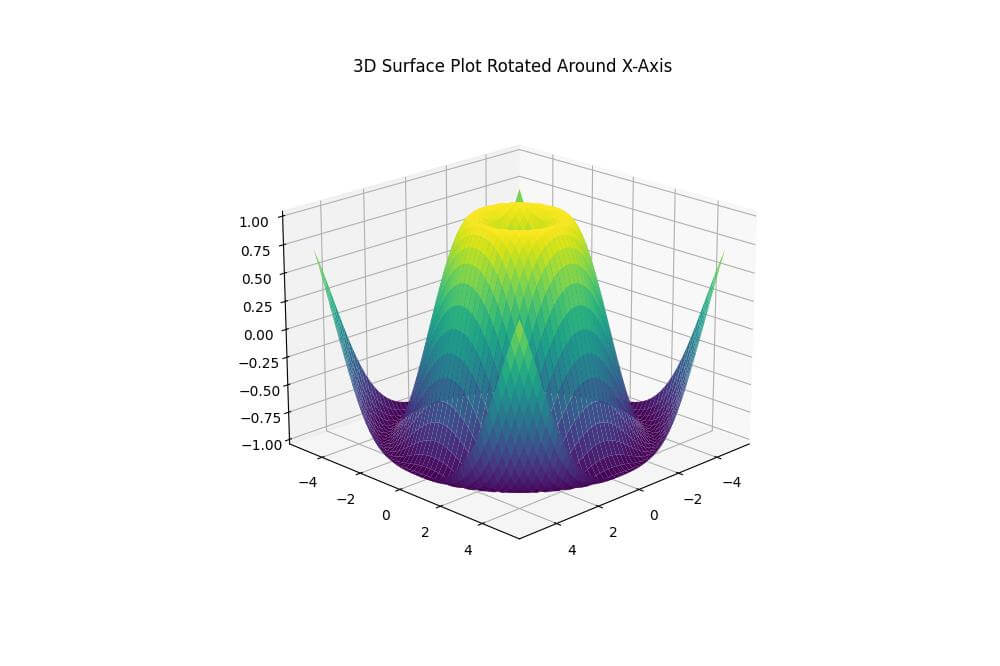
This code creates a 3D surface plot of a sinc function and rotates it around the X-axis.
The view_init() function sets the elevation angle to 20 degrees and the azimuth angle to 45 degrees.
Rotate Around the Y-Axis
Rotating around the Y-axis is similar to rotating around the X-axis. You’ll adjust the azimuth angle in the view_init() function.
Here’s an example using a different dataset:
import numpy as np
import matplotlib.pyplot as plt
from mpl_toolkits.mplot3d import Axes3D
theta = np.linspace(0, 2*np.pi, 100)
z = np.linspace(-2, 2, 100)
r = z**2 + 1
x = r * np.sin(theta)
y = r * np.cos(theta)
fig = plt.figure(figsize=(10, 7))
ax = fig.add_subplot(111, projection='3d')
ax.plot(x, y, z, label='Parametric Curve')

# Rotate around Y-axis
ax.view_init(elev=20, azim=90)
plt.title("3D Parametric Curve Rotated Around Y-Axis")
plt.legend()
plt.show()
Output:
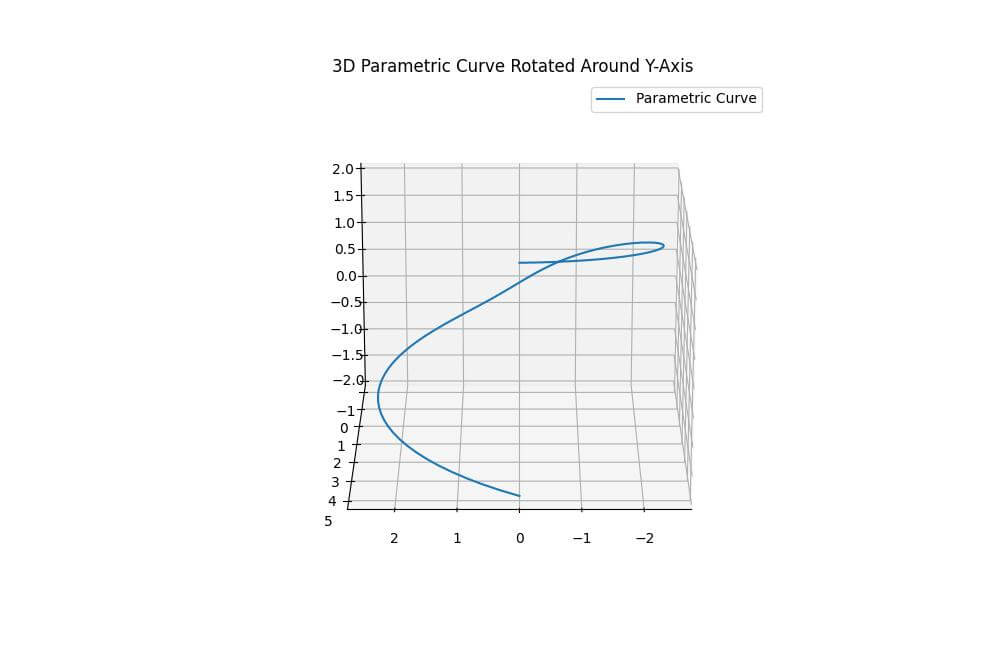
This code creates a 3D parametric curve and rotates it around the Y-axis.
The view_init() function sets the elevation angle to 20 degrees and the azimuth angle to 90 degrees.
Rotate Around the Z-Axis
To rotate around the Z-axis, you’ll primarily adjust the azimuth angle in the view_init() function.
Let’s create a 3D scatter plot and rotate it around the Z-axis:
import numpy as np
import matplotlib.pyplot as plt
from mpl_toolkits.mplot3d import Axes3D
n = 100
rng = np.random.default_rng(42)
xs = rng.uniform(-1, 1, n)
ys = rng.uniform(-1, 1, n)
zs = xs**2 + ys**2
colors = rng.uniform(0, 1, n)
fig = plt.figure(figsize=(10, 7))
ax = fig.add_subplot(111, projection='3d')
scatter = ax.scatter(xs, ys, zs, c=colors, cmap='viridis')
ax.view_init(elev=0, azim=45)
plt.title("3D Scatter Plot Rotated Around Z-Axis")
plt.colorbar(scatter)
plt.show()
Output:
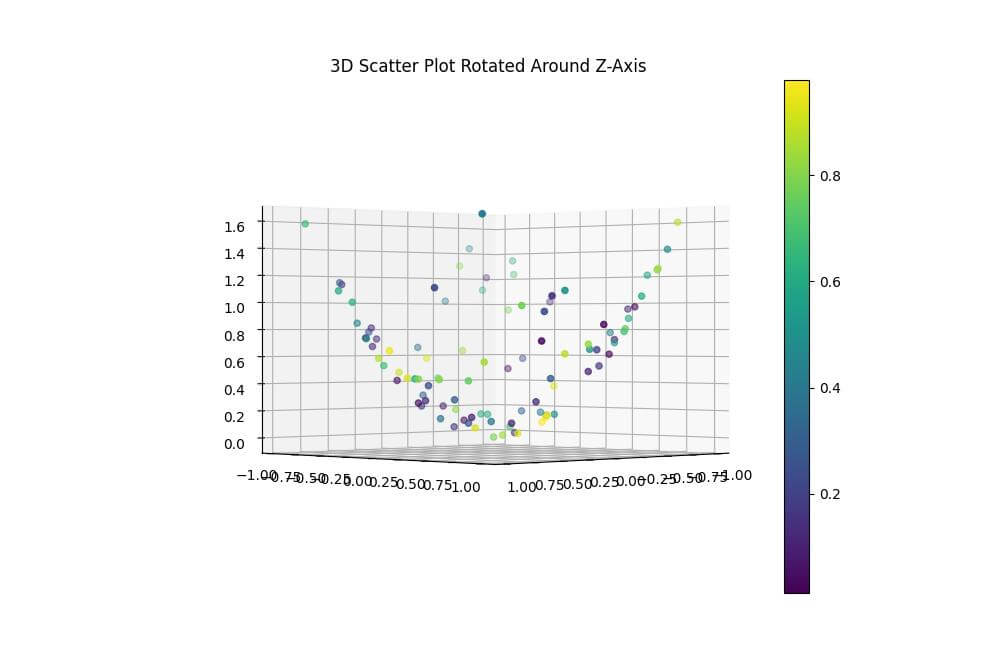
This code generates a 3D scatter plot of points on a paraboloid surface and rotates it around the Z-axis.
The view_init() function sets the elevation angle to 0 degrees (looking from the side) and the azimuth angle to 45 degrees.
Combination of Rotations
You can combine rotations around multiple axes by applying them sequentially.
Here’s an example that rotates a 3D line plot around all three axes:
import numpy as np
import matplotlib.pyplot as plt
from mpl_toolkits.mplot3d import Axes3D

# Create sample data
t = np.linspace(0, 10, 1000)
x = np.cos(t)
y = np.sin(t)
z = t
fig = plt.figure(figsize=(15, 5))

# Rotate around X-axis
ax1 = fig.add_subplot(131, projection='3d')
ax1.plot(x, y, z)
ax1.view_init(elev=30, azim=0)
ax1.set_title("Rotated around X-axis")

# Rotate around Y-axis
ax2 = fig.add_subplot(132, projection='3d')
ax2.plot(x, y, z)
ax2.view_init(elev=0, azim=90)
ax2.set_title("Rotated around Y-axis")

# Rotate around Z-axis
ax3 = fig.add_subplot(133, projection='3d')
ax3.plot(x, y, z)
ax3.view_init(elev=90, azim=45)
ax3.set_title("Rotated around Z-axis")
plt.tight_layout()
plt.show()
Output:
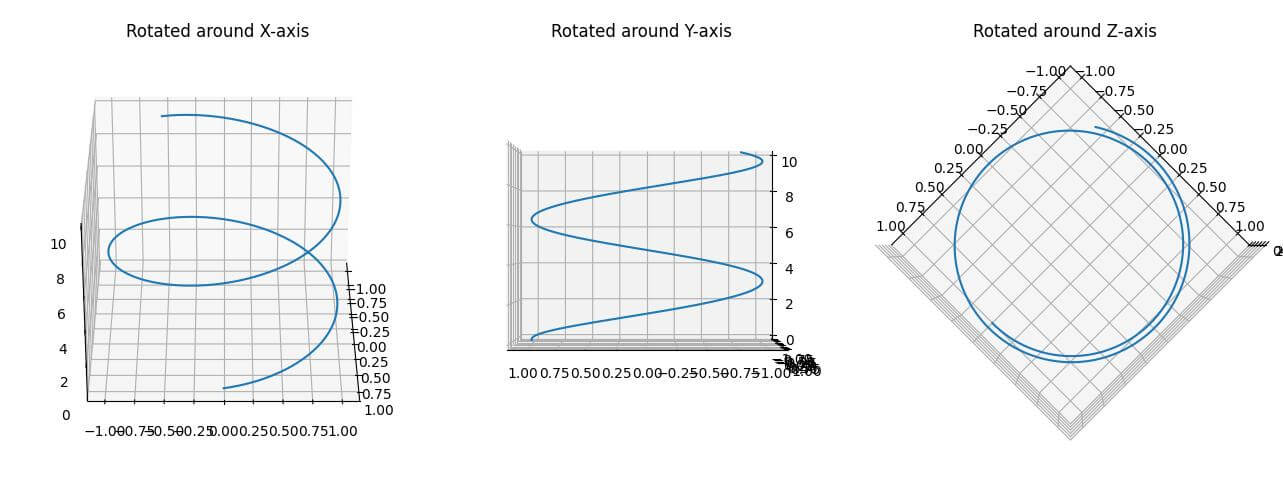
This code creates a 3D line plot of a helix and applies different rotations to three subplots.
Each subplot shows the helix rotated around a different axis.
Rotation by Quaternion
Here’s an example using quaternions to rotate a 3D scatter plot:
import numpy as np
import matplotlib.pyplot as plt
from mpl_toolkits.mplot3d import Axes3D
from scipy.spatial.transform import Rotation
n = 1000
rng = np.random.default_rng(42)
points = rng.uniform(-1, 1, (n, 3))

# Define rotation using quaternion
rotation_quat = Rotation.from_quat([0.5, 0.5, 0.5, 0.5])  # Rotation by 120 degrees around [1, 1, 1]

# Apply rotation
rotated_points = rotation_quat.apply(points)
fig = plt.figure(figsize=(15, 7))

# Original plot
ax1 = fig.add_subplot(121, projection='3d')
ax1.scatter(points[:, 0], points[:, 1], points[:, 2], c=points[:, 2], cmap='viridis')
ax1.set_title("Original Scatter")

# Rotated plot
ax2 = fig.add_subplot(122, projection='3d')
ax2.scatter(rotated_points[:, 0], rotated_points[:, 1], rotated_points[:, 2], c=rotated_points[:, 2], cmap='viridis')
ax2.set_title("Rotated Scatter")
plt.tight_layout()
plt.show()
Output:
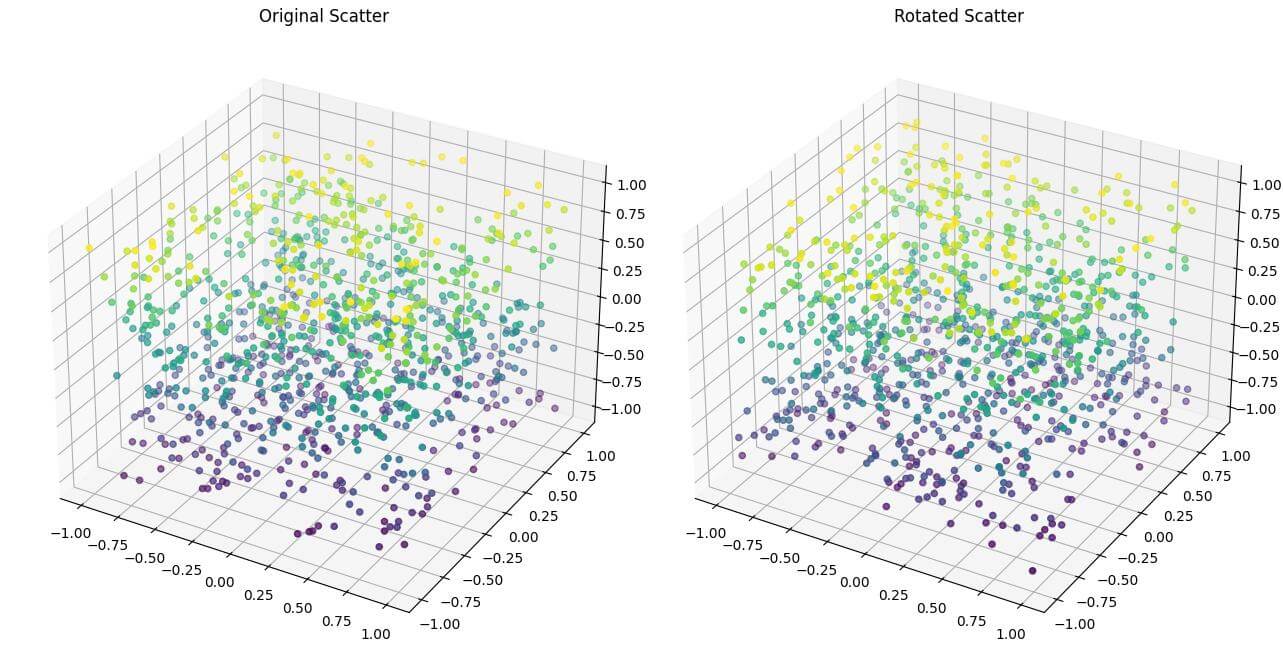
This code uses SciPy Rotation class to create a quaternion rotation.
The quaternion [0.5, 0.5, 0.5, 0.5] represents a rotation of 120 degrees around the axis [1, 1, 1].
Rotate Using Rotation Matrix
Here’s an example that uses a rotation matrix to rotate a 3D line plot:
import numpy as np
import matplotlib.pyplot as plt
from mpl_toolkits.mplot3d import Axes3D
def rotation_matrix(axis, theta):
  """
  Return the rotation matrix associated with counterclockwise rotation about
  the given axis by theta radians.
  """
  axis = np.asarray(axis)
  axis = axis / np.sqrt(np.dot(axis, axis))
  a = np.cos(theta / 2.0)
  b, c, d = -axis * np.sin(theta / 2.0)
  aa, bb, cc, dd = a * a, b * b, c * c, d * d
  bc, ad, ac, ab, bd, cd = b * c, a * d, a * c, a * b, b * d, c * d
  return np.array([[aa + bb - cc - dd, 2 * (bc + ad), 2 * (bd - ac)],
                   [2 * (bc - ad), aa + cc - bb - dd, 2 * (cd + ab)],
                   [2 * (bd + ac), 2 * (cd - ab), aa + dd - bb - cc]])
t = np.linspace(0, 10, 1000)
x = np.cos(t)
y = np.sin(t)
z = t / 3
axis = [1, 1, 1]  # Rotate around the vector [1, 1, 1]
theta = np.pi / 3  # Rotate by 60 degrees

# Apply rotation
rotation = rotation_matrix(axis, theta)
rotated_coords = np.dot(rotation, np.array([x, y, z]))
x_rot, y_rot, z_rot = rotated_coords

# Create the plot
fig = plt.figure(figsize=(15, 7))

# Original plot
ax1 = fig.add_subplot(121, projection='3d')
ax1.plot(x, y, z)
ax1.set_title("Original Helix")

# Rotated plot
ax2 = fig.add_subplot(122, projection='3d')
ax2.plot(x_rot, y_rot, z_rot)
ax2.set_title("Rotated Helix")
plt.tight_layout()
plt.show()
Output:
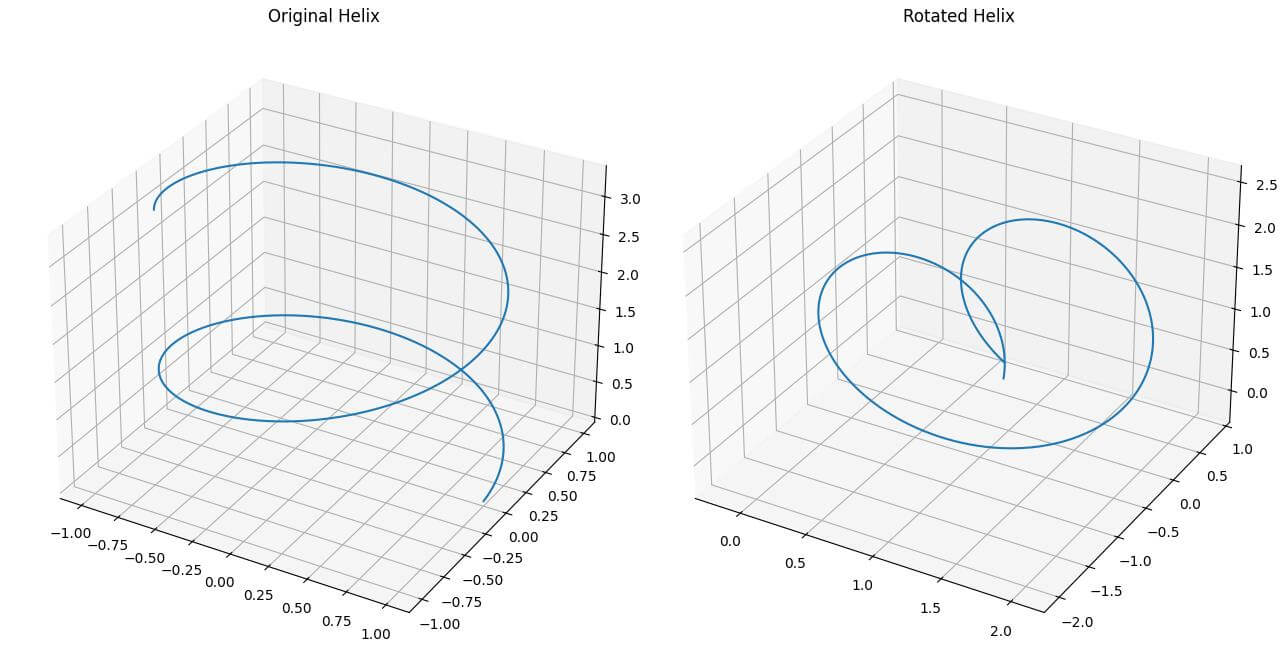
This code defines a function rotation_matrix() that creates a rotation matrix for rotating around an arbitrary axis.
It then applies this rotation to a 3D helix.
The helix rotated by 60 degrees around the vector [1, 1, 1] using a rotation matrix.
Mokhtar is the founder of LikeGeeks.com. He is a seasoned technologist and accomplished author, with expertise in Linux system administration and Python development. Since 2010, Mokhtar has built an impressive career, transitioning from system administration to Python development in 2015. His work spans large corporations to freelance clients around the globe. Alongside his technical work, Mokhtar has authored some insightful books in his field. Known for his innovative solutions, meticulous attention to detail, and high-quality work, Mokhtar continually seeks new challenges within the dynamic field of technology.