Create 3D Bubble Plots in Python with Matplotlib
In this tutorial, you’ll learn how to create 3D bubble plots using Python and Matplotlib.
3D bubble plots allow you to represent five dimensions: x, y, z coordinates, bubble size, and color.
Generate Data for 3D Bubble Plot
To begin, you’ll need to prepare your data. Let’s generate some sample data using NumPy:
import numpy as np
import matplotlib.pyplot as plt
from mpl_toolkits.mplot3d import Axes3D
np.random.seed(42)
n = 100
x = np.random.rand(n)
y = np.random.rand(n)
z = np.random.rand(n)
print("Sample data:")
print("x:", x[:5])
print("y:", y[:5])
print("z:", z[:5])
Output:
Sample data:
x: [0.37454012 0.95071431 0.73199394 0.59865848 0.15601864]
y: [0.03142919 0.63641041 0.31435598 0.50857069 0.90756647]
z: [0.64203165 0.08413996 0.16162871 0.89855419 0.60642906]
This code generates 100 random points in 3D space using the NumPy random seed.
Determine Bubble Sizes and Colors
Next, you’ll define the sizes and colors for your bubbles:
sizes = np.random.rand(n) * 100
colors = np.random.rand(n)
print("Bubble properties:")
print("sizes:", sizes[:5])
print("colors:", colors[:5])
Output:
Bubble properties:
sizes: [ 5.16817212 53.13546316 54.06351216 63.74299015 72.60913337]
colors: [0.10312387 0.90255291 0.50525237 0.82645747 0.3200496 ]
The sizes array determines the relative size of each bubble, while the colors array will be used to assign colors to the bubbles based on their values.
Create 3D Bubble Plot Using scatter3D function
To create a basic 3D bubble plot, you can use the scatter3D function from Matplotlib:
fig = plt.figure(figsize=(10, 8))
ax = fig.add_subplot(111, projection='3d')
scatter = ax.scatter3D(x, y, z, c=colors, s=sizes, alpha=0.6, cmap='viridis')
ax.set_xlabel('X axis')
ax.set_ylabel('Y axis')
ax.set_zlabel('Z axis')
ax.set_title('3D Bubble Plot')
plt.colorbar(scatter)
plt.show()
Output:
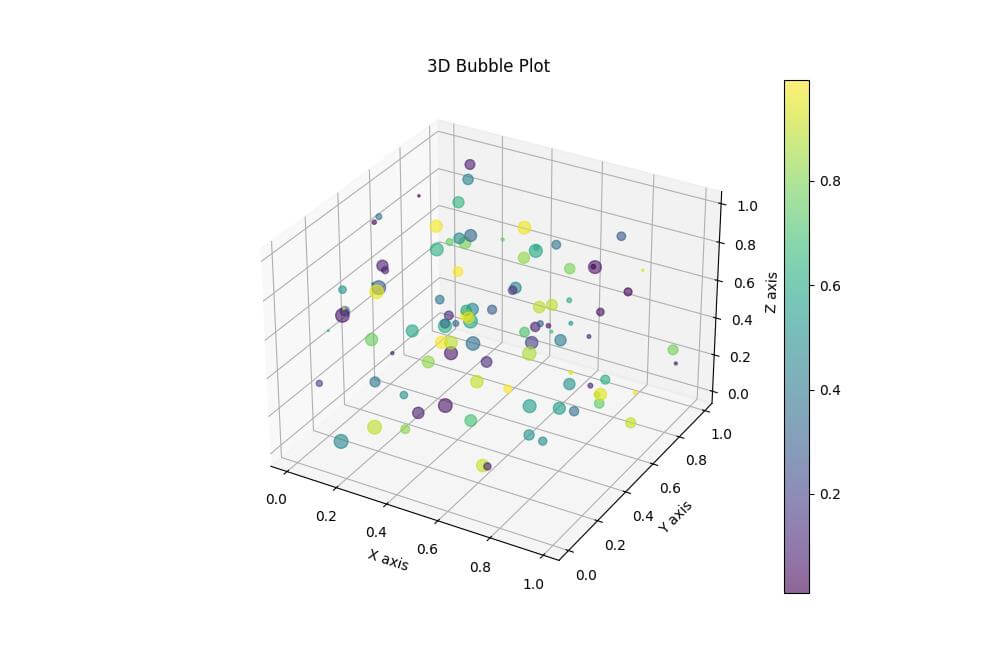
The c parameter sets the color of each point based on the colors array, while s determines the size of each point using the sizes array.
Change Bubble Shapes
Matplotlib offers various marker shapes for your bubbles. Here’s how you can use different shapes:
fig = plt.figure(figsize=(10, 8))
ax = fig.add_subplot(111, projection='3d')
scatter = ax.scatter3D(x[:50], y[:50], z[:50], c=colors[:50], s=sizes[:50], alpha=0.6, cmap='viridis', marker='o')
scatter = ax.scatter3D(x[50:], y[50:], z[50:], c=colors[50:], s=sizes[50:], alpha=0.6, cmap='viridis', marker='^')
ax.set_xlabel('X axis')
ax.set_ylabel('Y axis')
ax.set_zlabel('Z axis')
ax.set_title('3D Bubble Plot with Mixed Shapes')
plt.colorbar(scatter)
plt.show()
Output:
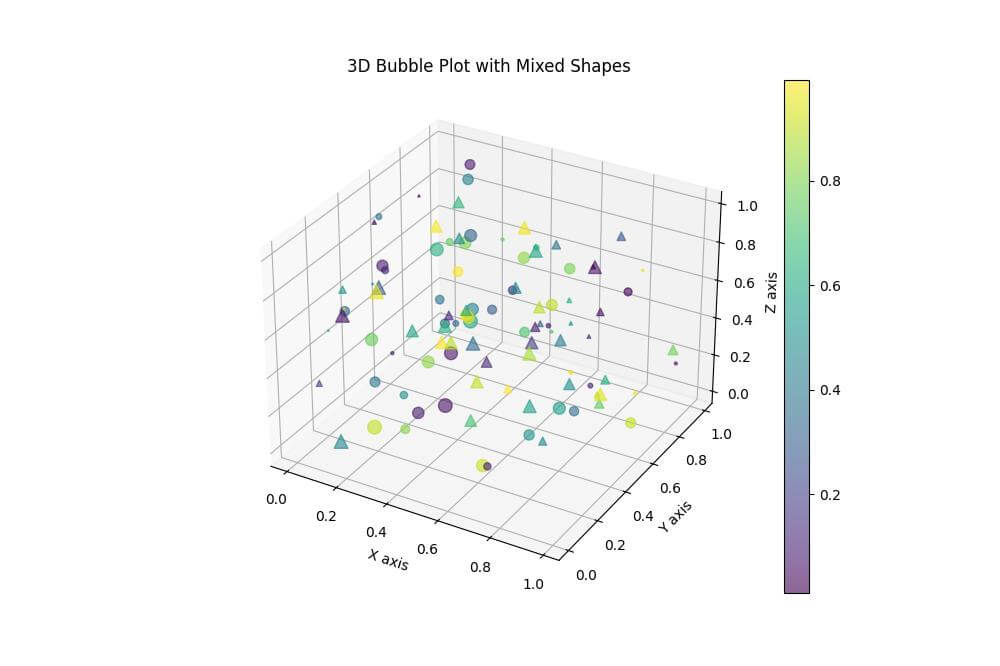
In this example, you’ve used circles (‘o’) for the first half of the data points and triangles (‘^’) for the second half.
Mokhtar is the founder of LikeGeeks.com. He is a seasoned technologist and accomplished author, with expertise in Linux system administration and Python development. Since 2010, Mokhtar has built an impressive career, transitioning from system administration to Python development in 2015. His work spans large corporations to freelance clients around the globe. Alongside his technical work, Mokhtar has authored some insightful books in his field. Known for his innovative solutions, meticulous attention to detail, and high-quality work, Mokhtar continually seeks new challenges within the dynamic field of technology.