Create Real-Time 3D Plot in Python (Live Plotting)
In this tutorial, you’ll learn how to create a real-time 3D plot in Python using Matplotlib.
You’ll learn how to set up a basic 3D plot, update it in real time, optimize performance, and handle multiple data sources.
Generate Sample Data for Real-Time Plotting
Create dynamic data sources
To simulate real-time data, you’ll create a function that generates dynamic 3D data points.
This function will update the data on each call.
You can use NumPy to create a simple function that generates 3D data points:
import numpy as np
def generate_data(t):
    x = np.linspace(-5, 5, 100)
    y = np.linspace(-5, 5, 100)
    X, Y = np.meshgrid(x, y)
    Z = np.sin(np.sqrt(X**2 + Y**2) + t)
    return X, Y, Z
X, Y, Z = generate_data(0)
print(f"Shape of X: {X.shape}")
print(f"Shape of Y: {Y.shape}")
print(f"Shape of Z: {Z.shape}")
print(f"Sample Z values:\n{Z[:5, :5]}")
Output:
Shape of X: (100, 100)
Shape of Y: (100, 100)
Shape of Z: (100, 100)
Sample Z values:
[[0.70886129 0.65699209 0.60240054 0.54547433 0.48660103]
 [0.65699209 0.60122453 0.54297829 0.48265732 0.42066325]
 [0.60240054 0.54297829 0.48133998 0.41790473 0.35308719]
 [0.54547433 0.48265732 0.41790473 0.35164986 0.28431914]
 [0.48660103 0.42066325 0.35308719 0.28431914 0.21479613]]
The generate_data function creates a 3D surface using the sine function and a time parameter t.
The resulting X, Y, and Z arrays have shapes of (100, 100), representing a 100×100 grid of 3D points.
The sample Z values show a portion of the generated surface.
Simulate Real-time data Streams
To simulate a real-time data stream, you’ll create a generator function that yields new data points at regular intervals.
You can use the time module to control the data generation rate:
import time
def data_stream():
    t = 0
    while True:
        yield generate_data(t)
        t += 0.1
        time.sleep(0.1)  # Simulate 10 FPS data stream
stream = data_stream()
for _ in range(3):
    X, Y, Z = next(stream)
    print(f"Time step: {_}")
    print(f"Sample Z values:\n{Z[:3, :3]}")
    print()
Output:
Time step: 0
Sample Z values:
[[0.70886129 0.65699209 0.60240054]
 [0.65699209 0.60122453 0.54297829]
 [0.60240054 0.54297829 0.48133998]]

Time step: 1
Sample Z values:
[[0.77573723 0.72897403 0.67907748]
 [0.72897403 0.67799581 0.62410045]
 [0.67907748 0.62410045 0.56644267]]

Time step: 2
Sample Z values:
[[0.83486226 0.7936723  0.74896929]
 [0.7936723  0.74799278 0.6989868 ]
 [0.74896929 0.6989868  0.64588564]]
The data_stream generator function continuously yields new data points, simulating a real-time data stream at 10 frames per second.
The sample output shows how the Z values change over time, demonstrating the dynamic nature of the generated data.
Basic 3D Plot
You can set up a basic 3D plot using Matplotlib like this:
import matplotlib.pyplot as plt
from mpl_toolkits.mplot3d import Axes3D
fig = plt.figure(figsize=(10, 8))
ax = fig.add_subplot(111, projection='3d')
X, Y, Z = next(data_stream())
surf = ax.plot_surface(X, Y, Z, cmap='viridis')
ax.set_xlabel('X')
ax.set_ylabel('Y')
ax.set_zlabel('Z')
ax.set_title('Real-Time 3D Plot')
plt.colorbar(surf)
plt.show()
Output:
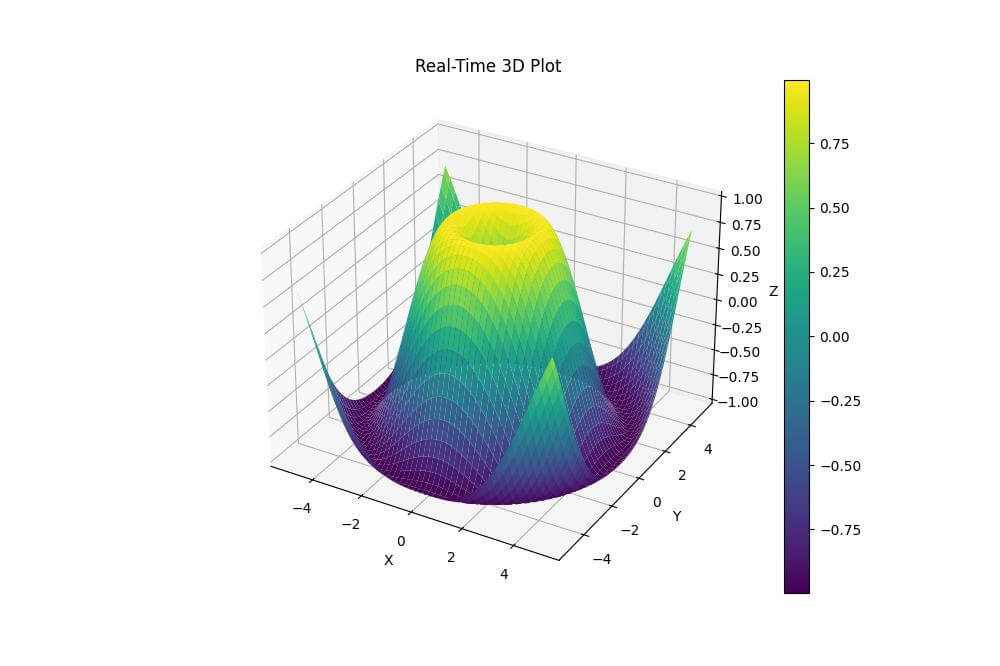
The resulting plot will be a static representation of the initial data.
In the next section, you’ll learn how to update this plot in real-time.
Update the 3D Plot in Real Time
To update the 3D plot in real time, you’ll use Matplotlib animation functionality.
This allows you to redraw the plot with new data at regular intervals.
You can implement real-time updates using Matplotlib FuncAnimation:
import matplotlib.pyplot as plt
from mpl_toolkits.mplot3d import Axes3D
from matplotlib.animation import FuncAnimation
fig = plt.figure(figsize=(10, 8))
ax = fig.add_subplot(111, projection='3d')
X, Y, Z = next(stream)
surf = ax.plot_surface(X, Y, Z, cmap='viridis')
ax.set_xlabel('X')
ax.set_ylabel('Y')
ax.set_zlabel('Z')
ax.set_title('Real-Time 3D Plot')
fig.colorbar(surf, ax=ax)

def update(frame):
    ax.clear()
    X, Y, Z = next(stream)
    surf = ax.plot_surface(X, Y, Z, cmap='viridis')
    ax.set_xlabel('X')
    ax.set_ylabel('Y')
    ax.set_zlabel('Z')
    ax.set_zlim(-1, 1)
    ax.set_title(f'Real-Time 3D Plot (Frame {frame})')
    return surf,
ani = FuncAnimation(fig, update, frames=200, interval=100, blit=False)
plt.show()
Output:
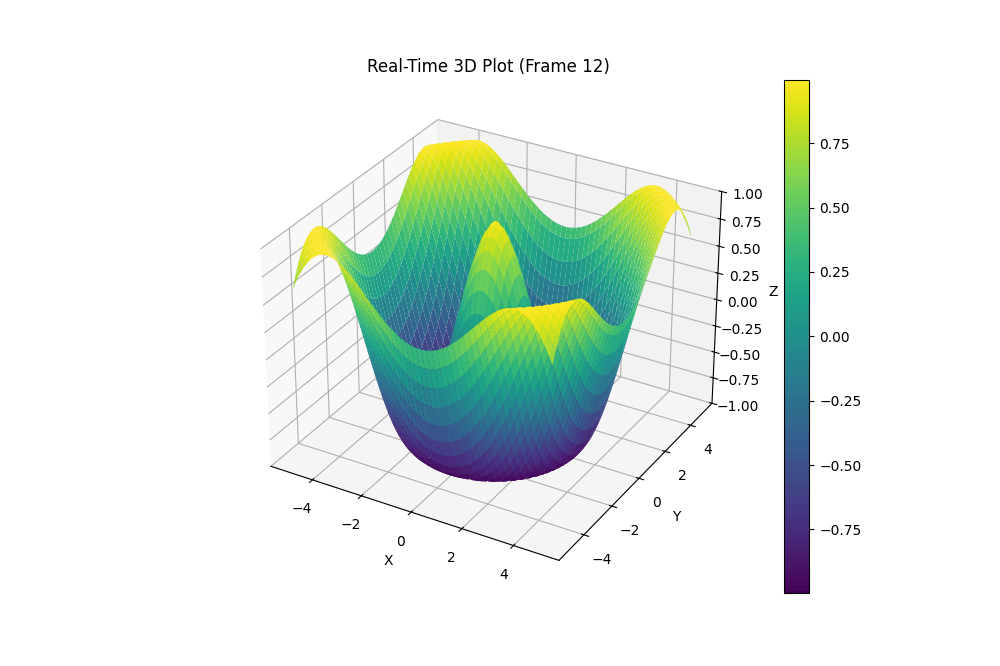
This code creates an animation that updates the 3D plot every 100 milliseconds (10 FPS) for 200 frames.
The update function clears the previous plot, generates new data, and redraws the surface plot.
Handle Multiple Data Sources
Plot multiple data streams
To handle multiple data sources, you can create separate data streams and plot them on the same 3D axes.
You can plot multiple data streams like this:
import matplotlib.pyplot as plt
from mpl_toolkits.mplot3d import Axes3D
from matplotlib.animation import FuncAnimation
def generate_data_2(t):
  x = np.linspace(-5, 5, 100)
  y = np.linspace(-5, 5, 100)
  X, Y = np.meshgrid(x, y)
  Z = np.cos(np.sqrt(X**2 + Y**2) + t)
  return X, Y, Z
def data_stream_2():
  t = 0
  while True:
    yield generate_data_2(t)
    t += 0.1
    time.sleep(0.1)
fig = plt.figure(figsize=(12, 10))
ax = fig.add_subplot(111, projection='3d')
stream1 = data_stream()
stream2 = data_stream_2()
X1, Y1, Z1 = next(stream1)
X2, Y2, Z2 = next(stream2)
surf1 = ax.plot_surface(X1, Y1, Z1, cmap='viridis', alpha=0.7)
surf2 = ax.plot_surface(X2, Y2, Z2, cmap='plasma', alpha=0.7)
ax.set_xlabel('X')
ax.set_ylabel('Y')
ax.set_zlabel('Z')
ax.set_title('Real-Time 3D Plot with Multiple Data Sources')

def update(frame):
  ax.clear()
  global surf1, surf2
  X1, Y1, Z1 = next(stream1)
  X2, Y2, Z2 = next(stream2)
  surf1 = ax.plot_surface(X1, Y1, Z1, cmap='viridis', alpha=0.7)
  surf2 = ax.plot_surface(X2, Y2, Z2, cmap='plasma', alpha=0.7)
  ax.set_title(f'Real-Time 3D Plot with Multiple Data Sources (Frame {frame})')
  return surf1, surf2
ani = FuncAnimation(fig, update, frames=200, interval=100, blit=False)
plt.show()
Output:
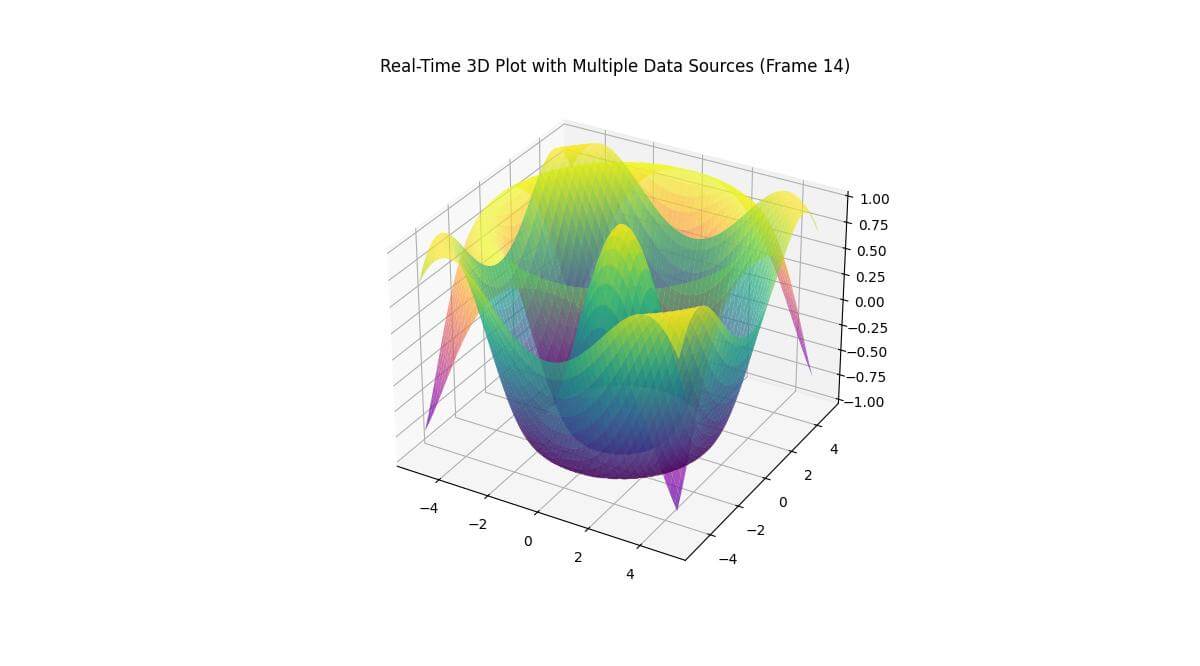
This code creates two separate data streams and plots them on the same 3D axes using different color maps and transparency levels.
The resulting animation will show two dynamically changing surfaces overlaid on each other.
Synchronize updates
To ensure that multiple data sources are updated synchronously, you can use a single timer or animation function to update all data streams simultaneously.
You can synchronize updates for multiple data streams like this:
import matplotlib.pyplot as plt
from mpl_toolkits.mplot3d import Axes3D
from matplotlib.animation import FuncAnimation
fig = plt.figure(figsize=(12, 10))
ax1 = fig.add_subplot(121, projection='3d')
ax2 = fig.add_subplot(122, projection='3d')
stream1 = data_stream()
stream2 = data_stream_2()
X1, Y1, Z1 = next(stream1)
X2, Y2, Z2 = next(stream2)
surf1 = ax1.plot_surface(X1, Y1, Z1, cmap='viridis')
surf2 = ax2.plot_surface(X2, Y2, Z2, cmap='plasma')
ax1.set_title('Data Source 1')
ax2.set_title('Data Source 2')
for ax in (ax1, ax2):
    ax.set_xlabel('X')
    ax.set_ylabel('Y')
    ax.set_zlabel('Z')

def update(frame):
    ax.clear()
    global surf1, surf2
    X1, Y1, Z1 = next(stream1)
    X2, Y2, Z2 = next(stream2)
    surf1 = ax1.plot_surface(X1, Y1, Z1, cmap='viridis')
    surf2 = ax2.plot_surface(X2, Y2, Z2, cmap='plasma')
    ax1.set_title(f'Data Source 1 (Frame {frame})')
    ax2.set_title(f'Data Source 2 (Frame {frame})')
    return surf1, surf2
ani = FuncAnimation(fig, update, frames=200, interval=100, blit=False)
plt.show()
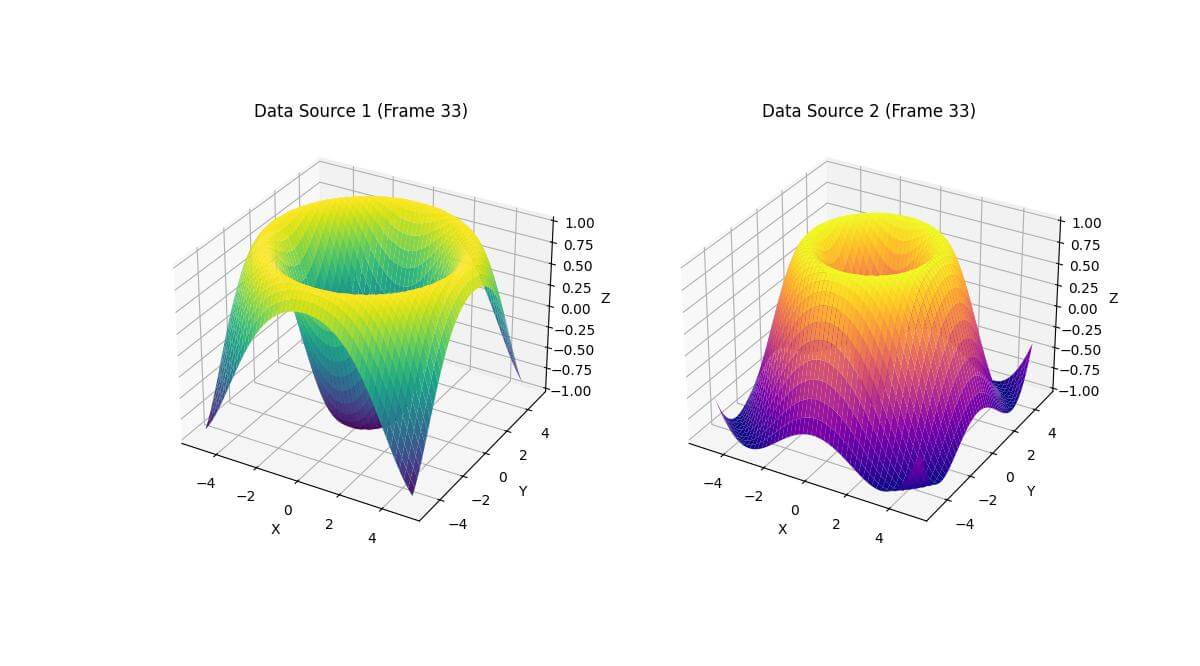
Output:
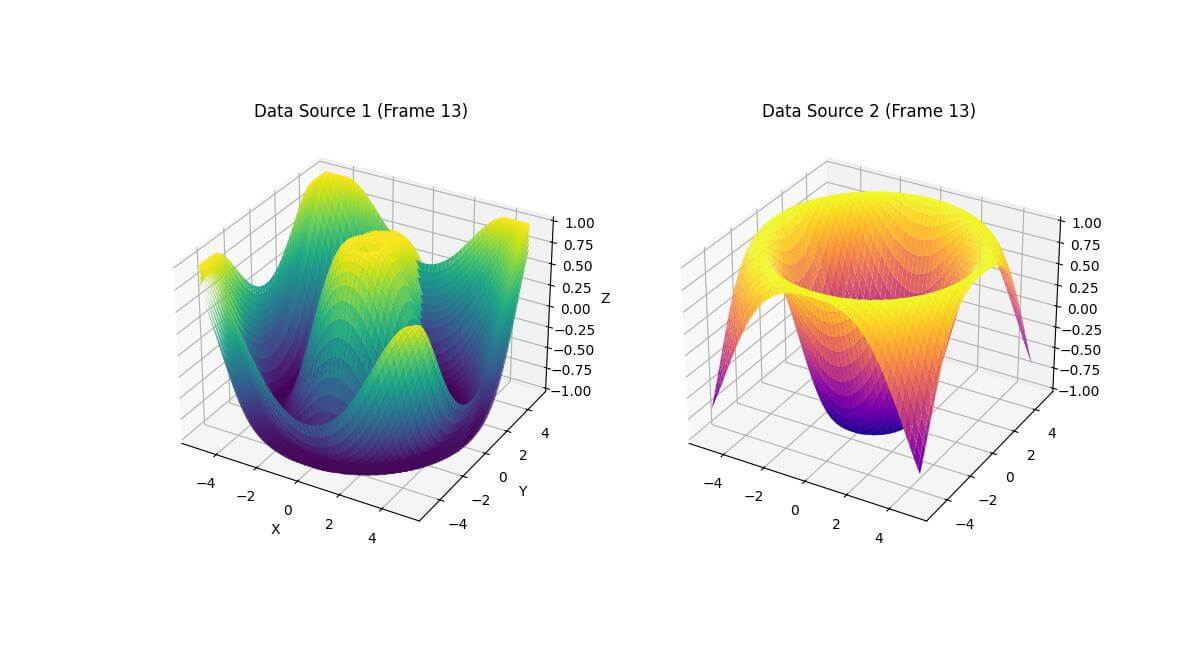
The update function synchronously updates both plots, ensuring that they remain in sync throughout the animation.
The resulting visualization will show two side-by-side 3D plots updating simultaneously.
Optimize Performance for Real-time Updates
To improve the redraw speed of the plot, you can make several optimizations:
Avoid Clearing the Axes: Instead of clearing the axes with ax.clear(), update the data of the existing plot objects. This avoids the overhead of re-creating the plot objects.
Reduce Data Resolution: If the data resolution is higher than necessary, consider reducing it to speed up rendering.
Data Update: Directly update the data of the plot objects if possible, though in this case, re-plotting is used due to the nature of plot_surface.
import numpy as np
import matplotlib.pyplot as plt
from mpl_toolkits.mplot3d import Axes3D
from matplotlib.animation import FuncAnimation
import time

def generate_data(t):
  x = np.linspace(-5, 5, 50)  # Reduced resolution
  y = np.linspace(-5, 5, 50)
  X, Y = np.meshgrid(x, y)
  Z = np.sin(np.sqrt(X**2 + Y**2) + t)
  return X, Y, Z

def generate_data_2(t):
  x = np.linspace(-5, 5, 50)  # Reduced resolution
  y = np.linspace(-5, 5, 50)
  X, Y = np.meshgrid(x, y)
  Z = np.cos(np.sqrt(X**2 + Y**2) + t)
  return X, Y, Z

def data_stream():
  t = 0
  while True:
    yield generate_data(t)
    t += 0.1
    time.sleep(0.1)

def data_stream_2():
  t = 0
  while True:
    yield generate_data_2(t)
    t += 0.1
    time.sleep(0.1)

fig = plt.figure(figsize=(12, 10))
ax1 = fig.add_subplot(121, projection='3d')
ax2 = fig.add_subplot(122, projection='3d')
stream1 = data_stream()
stream2 = data_stream_2()
X1, Y1, Z1 = next(stream1)
X2, Y2, Z2 = next(stream2)
surf1 = ax1.plot_surface(X1, Y1, Z1, cmap='viridis')
surf2 = ax2.plot_surface(X2, Y2, Z2, cmap='plasma')
ax1.set_title('Data Source 1')
ax2.set_title('Data Source 2')
for ax in (ax1, ax2):
  ax.set_xlabel('X')
  ax.set_ylabel('Y')
  ax.set_zlabel('Z')

def update(frame):
  global surf1, surf2
  X1, Y1, Z1 = next(stream1)
  X2, Y2, Z2 = next(stream2)
  surf1.remove()
  surf2.remove()
  surf1 = ax1.plot_surface(X1, Y1, Z1, cmap='viridis')
  surf2 = ax2.plot_surface(X2, Y2, Z2, cmap='plasma')
  ax1.set_title(f'Data Source 1 (Frame {frame})')
  ax2.set_title(f'Data Source 2 (Frame {frame})')
  return surf1, surf2
ani = FuncAnimation(fig, update, frames=200, interval=100, blit=False)
plt.show()
Output:
The updated code is twice as fast as the original code.
Mokhtar is the founder of LikeGeeks.com. He is a seasoned technologist and accomplished author, with expertise in Linux system administration and Python development. Since 2010, Mokhtar has built an impressive career, transitioning from system administration to Python development in 2015. His work spans large corporations to freelance clients around the globe. Alongside his technical work, Mokhtar has authored some insightful books in his field. Known for his innovative solutions, meticulous attention to detail, and high-quality work, Mokhtar continually seeks new challenges within the dynamic field of technology.