How to Draw a Circle in Python 3D Plot
Drawing a circle in a 3D plot using Python can be done through various libraries.
This tutorial will guide you through different methods for creating and manipulating 3D circles using popular Python libraries such as Matplotlib, Plotly, VPython, PyVista, and Mayavi.
Using Matplotlib
To create a 3D circle plot, you can use the following code:
import numpy as np
import matplotlib.pyplot as plt
from mpl_toolkits.mplot3d import Axes3D

# Generate circle points
theta = np.linspace(0, 2*np.pi, 100)
x = np.cos(theta)
y = np.sin(theta)
z = np.zeros_like(theta)
fig = plt.figure()
ax = fig.add_subplot(111, projection='3d')
ax.plot(x, y, z)
ax.set_xlabel('X')
ax.set_ylabel('Y')
ax.set_zlabel('Z')
ax.set_title('Circle in 3D Plot')
plt.show()
Output:
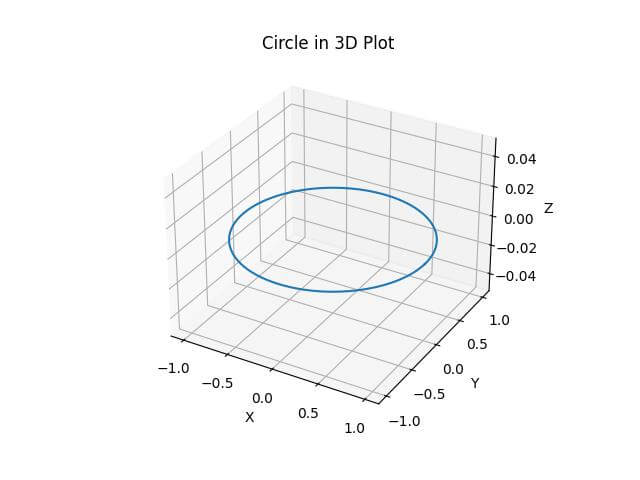
This code generates a circle in the XY plane centered at the origin with a radius of 1.
The circle is represented by 100 points.
Rotate the circle
To rotate the circle in 3D space, you can apply a rotation matrix to the circle’s coordinates:
import numpy as np
import matplotlib.pyplot as plt
from mpl_toolkits.mplot3d import Axes3D
theta = np.linspace(0, 2*np.pi, 100)
x = np.cos(theta)
y = np.sin(theta)
z = np.zeros_like(theta)

# Rotation angle (in radians)
angle = np.pi/4

# Rotation matrix (rotate around Y-axis)
rotation_matrix = np.array([
    [np.cos(angle), 0, np.sin(angle)],
    [0, 1, 0],
    [-np.sin(angle), 0, np.cos(angle)]
])

# Apply rotation
rotated_points = np.dot(rotation_matrix, np.array([x, y, z]))
fig = plt.figure()
ax = fig.add_subplot(111, projection='3d')
ax.plot(rotated_points[0], rotated_points[1], rotated_points[2])
ax.set_xlabel('X')
ax.set_ylabel('Y')
ax.set_zlabel('Z')
ax.set_title('Rotated Circle in 3D Plot')
plt.show()
Output:
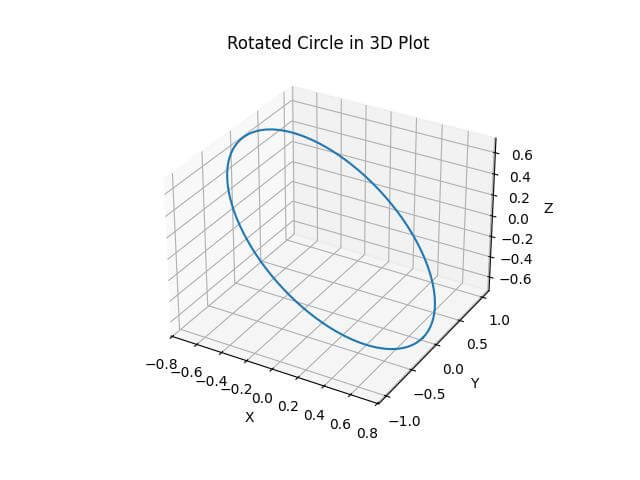
This code rotates the circle 45 degrees around the Y-axis.
Plot Multiple Circles
You can create multiple circles in different orientations and positions:
import numpy as np
import matplotlib.pyplot as plt
from mpl_toolkits.mplot3d import Axes3D
def create_circle(center, normal):
theta = np.linspace(0, 2*np.pi, 100)
x = np.cos(theta)
y = np.sin(theta)
z = np.zeros_like(theta)
normal = normal / np.linalg.norm(normal)
rotation_axis = np.cross([0, 0, 1], normal)
rotation_angle = np.arccos(np.dot([0, 0, 1], normal))
rotation_matrix = np.array([
[np.cos(rotation_angle) + rotation_axis[0]**2 * (1 - np.cos(rotation_angle)),
rotation_axis[0] * rotation_axis[1] * (1 - np.cos(rotation_angle)) - rotation_axis[2] * np.sin(rotation_angle),
rotation_axis[0] * rotation_axis[2] * (1 - np.cos(rotation_angle)) + rotation_axis[1] * np.sin(rotation_angle)],
[rotation_axis[1] * rotation_axis[0] * (1 - np.cos(rotation_angle)) + rotation_axis[2] * np.sin(rotation_angle),
np.cos(rotation_angle) + rotation_axis[1]**2 * (1 - np.cos(rotation_angle)),
rotation_axis[1] * rotation_axis[2] * (1 - np.cos(rotation_angle)) - rotation_axis[0] * np.sin(rotation_angle)],
[rotation_axis[2] * rotation_axis[0] * (1 - np.cos(rotation_angle)) - rotation_axis[1] * np.sin(rotation_angle),
rotation_axis[2] * rotation_axis[1] * (1 - np.cos(rotation_angle)) + rotation_axis[0] * np.sin(rotation_angle),
np.cos(rotation_angle) + rotation_axis[2]**2 * (1 - np.cos(rotation_angle))]
])
# Apply rotation and translation
rotated_points = np.dot(rotation_matrix, np.array([x, y, z]))
translated_points = rotated_points + np.array(center)[:, np.newaxis]
return translated_points
fig = plt.figure()
ax = fig.add_subplot(111, projection='3d')
# Plot multiple circles
circles = [
((0, 0, 0), (0, 0, 1)),
((2, 2, 2), (1, 1, 1)),
((-1, 1, -1), (0, 1, 1)),
]
for center, normal in circles:
circle_points = create_circle(center, normal)
ax.plot(circle_points[0], circle_points[1], circle_points[2])
ax.set_xlabel('X')
ax.set_ylabel('Y')
ax.set_zlabel('Z')
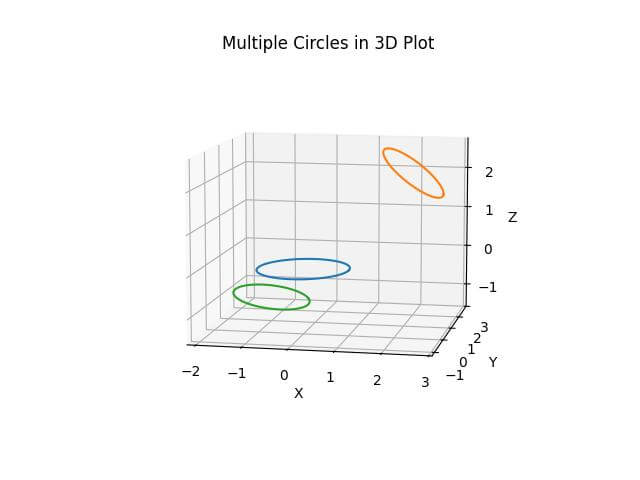
ax.set_title('Multiple Circles in 3D Plot')
plt.show()
Output:
Using Plotly
Here’s how you can create a 3D circle using Plotly:
import numpy as np
import plotly.graph_objects as go
theta = np.linspace(0, 2*np.pi, 100)
x = np.cos(theta)
y = np.sin(theta)
z = np.zeros_like(theta)
fig = go.Figure(data=[go.Scatter3d(x=x, y=y, z=z, mode='lines')])
fig.update_layout(
    scene=dict(
        xaxis_title='X',
        yaxis_title='Y',
        zaxis_title='Z'
    ),
    title='Circle in 3D Plot (Plotly)'
)
fig.show()
Output:
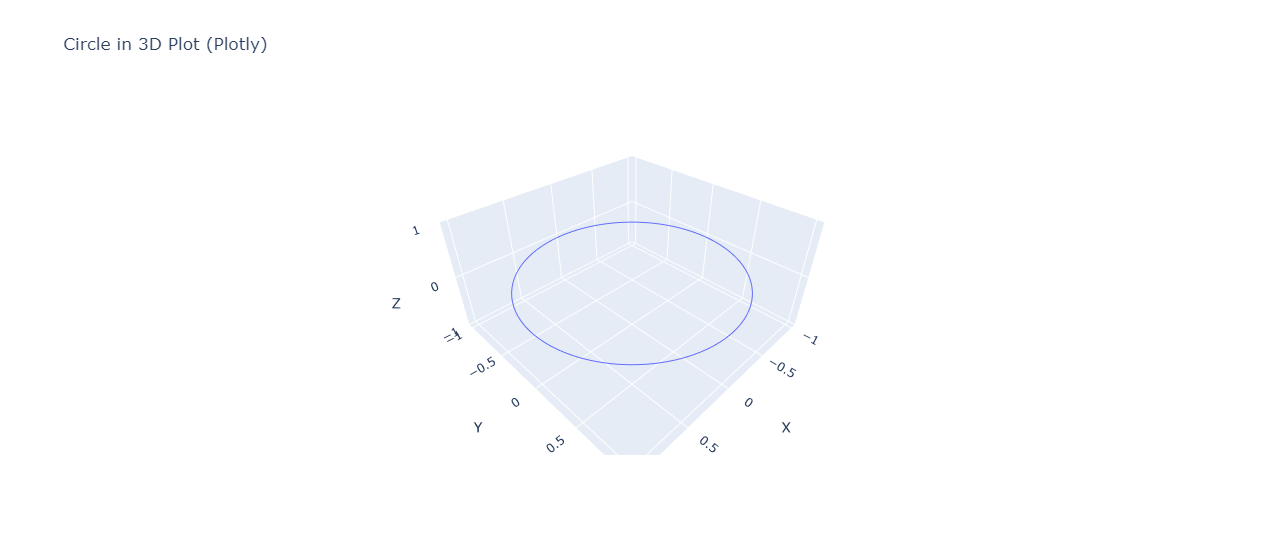
You can rotate and zoom the plot in your browser.
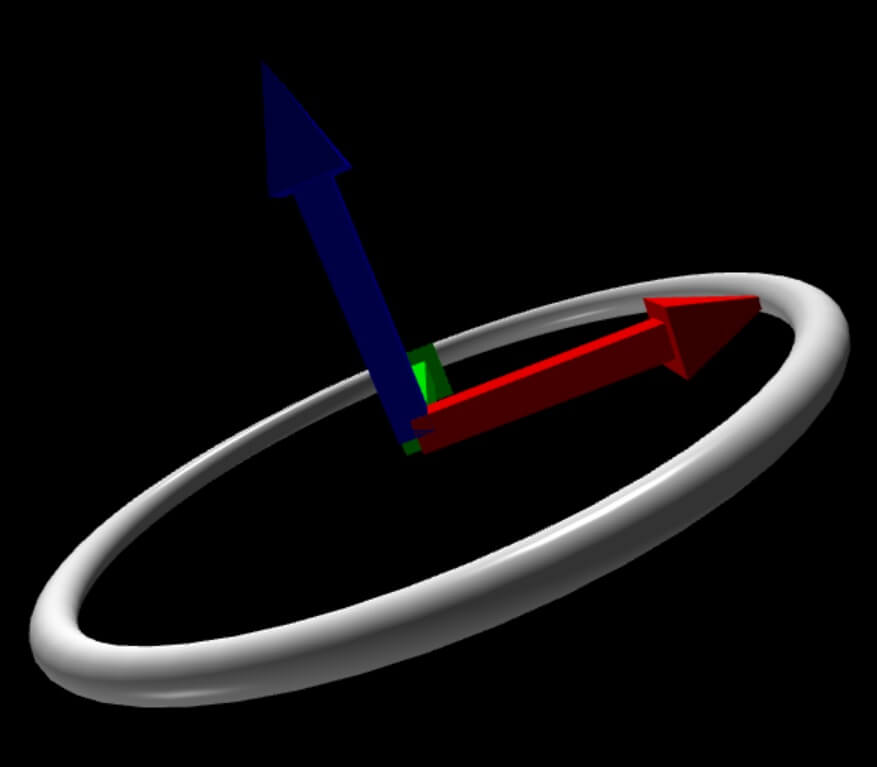
Using VPython
Here’s how to draw a circle using VPython:
from vpython import *
canvas(title='Circle in 3D (VPython)', width=800, height=600)

# Create a circle
ring(pos=vector(0, 0, 0), axis=vector(0, 0, 1), radius=1, thickness=0.05)
arrow(pos=vector(0, 0, 0), axis=vector(1, 0, 0), color=color.red)
arrow(pos=vector(0, 0, 0), axis=vector(0, 1, 0), color=color.green)
arrow(pos=vector(0, 0, 0), axis=vector(0, 0, 1), color=color.blue)
while True:
    rate(100)
Output:
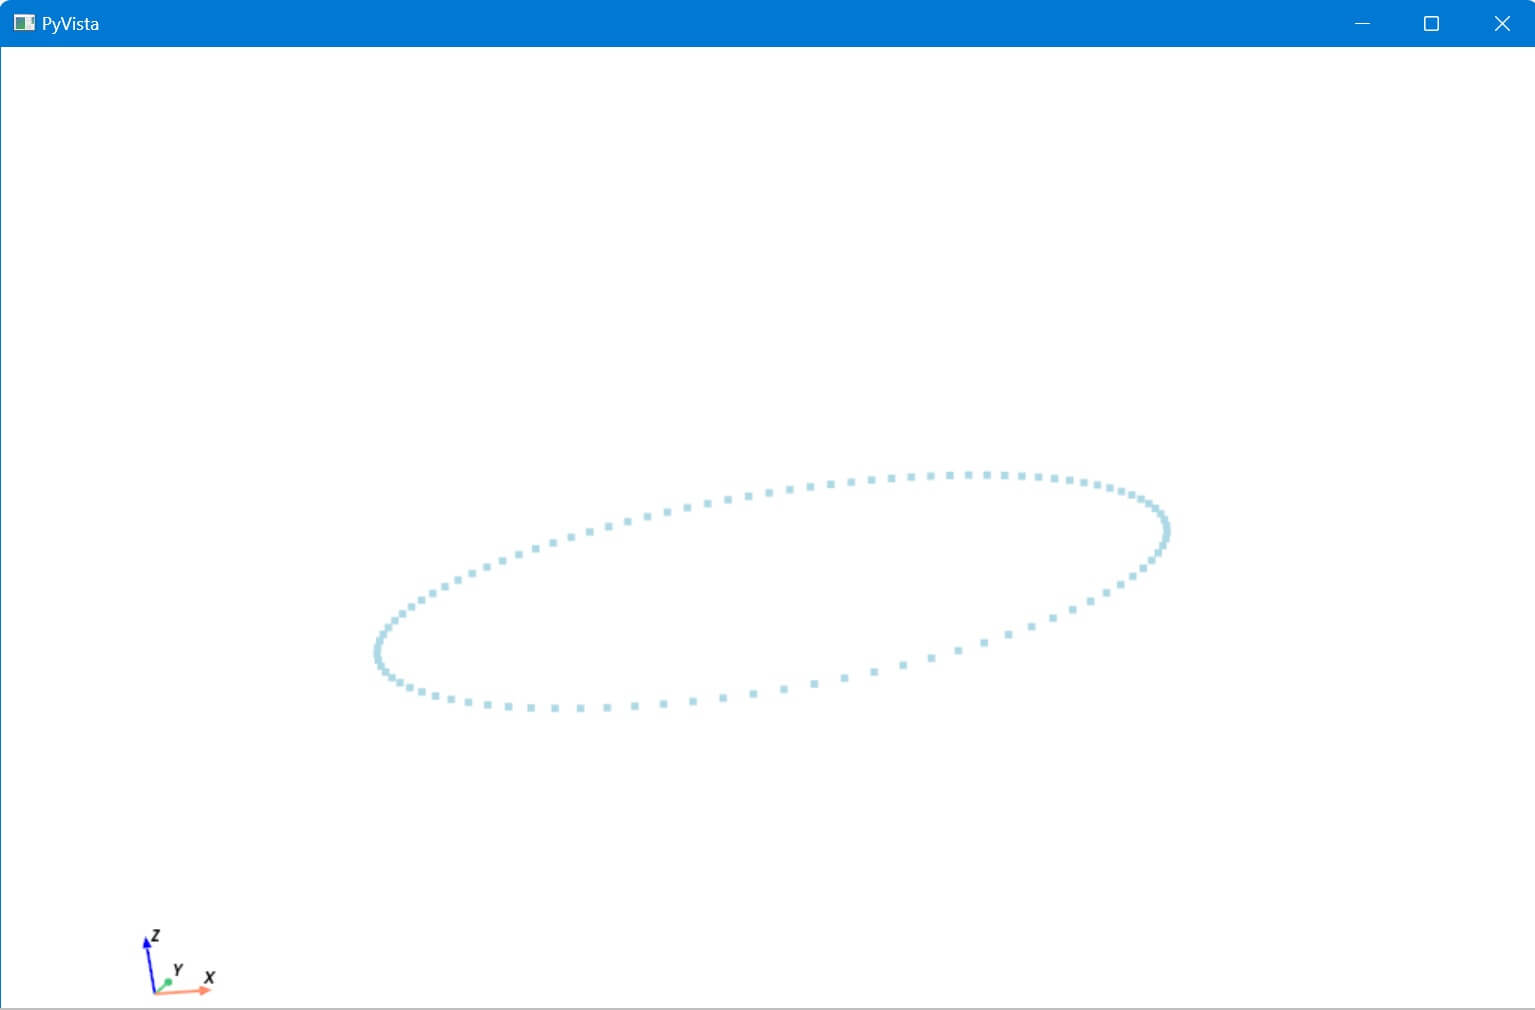
Using PyVista
Here’s how to create a circle using PyVista:
import numpy as np
import pyvista as pv
theta = np.linspace(0, 2*np.pi, 100)
x = np.cos(theta)
y = np.sin(theta)
z = np.zeros_like(theta)
circle = pv.PolyData(np.column_stack((x, y, z)))
plotter = pv.Plotter()
plotter.add_mesh(circle, render_lines_as_tubes=True, line_width=10)
plotter.add_axes()
plotter.camera_position = [(0, 0, 5), (0, 0, 0), (0, 1, 0)]
plotter.show()
Output:
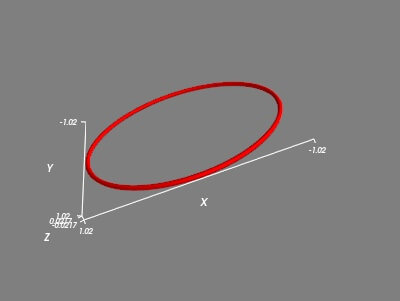
Using Mayavi
Here’s how to create a circle using Mayavi:
import numpy as np
from mayavi import mlab
theta = np.linspace(0, 2*np.pi, 100)
x = np.cos(theta)
y = np.sin(theta)
z = np.zeros_like(theta)
mlab.figure('Circle in 3D (Mayavi)')
mlab.plot3d(x, y, z, tube_radius=0.025, color=(1, 0, 0))
mlab.axes()
mlab.show()
Output:
Mokhtar is the founder of LikeGeeks.com. He is a seasoned technologist and accomplished author, with expertise in Linux system administration and Python development. Since 2010, Mokhtar has built an impressive career, transitioning from system administration to Python development in 2015. His work spans large corporations to freelance clients around the globe. Alongside his technical work, Mokhtar has authored some insightful books in his field. Known for his innovative solutions, meticulous attention to detail, and high-quality work, Mokhtar continually seeks new challenges within the dynamic field of technology.