How to Plot 3D Ellipsoid in Python
Plotting 3D ellipsoids in Python allows you to visualize three-dimensional data or geometric shapes.
In this tutorial, you’ll learn how to create 3D ellipsoid visualizations using popular Python libraries such as Matplotlib, Plotly, and Mayavi.
Define the ellipsoid equation
To begin, you’ll need to define the equation of the ellipsoid. The general equation for an ellipsoid centered at the origin is:
import numpy as np

# Define ellipsoid parameters
a, b, c = 2, 3, 4  # Semi-axes lengths

# Ellipsoid equation
def ellipsoid_equation(x, y, z):
    return (x**2 / a**2) + (y**2 / b**2) + (z**2 / c**2)

# Test the equation
x, y, z = 1, 1, 1
result = ellipsoid_equation(x, y, z)
print(f"Equation result for point (1, 1, 1): {result}")
Output:
Equation result for point (1, 1, 1): 0.4236111111111111
The output shows the result of the ellipsoid equation for the point (1, 1, 1).
A value less than 1 indicates that the point is inside the ellipsoid, while a value greater than 1 means it’s outside.
Generate Ellipsoid Points
Parametric equations for ellipsoid
To generate points on the ellipsoid surface, you’ll use parametric equations:
def ellipsoid_surface(u, v):
    x = a * np.sin(u) * np.cos(v)
    y = b * np.sin(u) * np.sin(v)
    z = c * np.cos(u)
    return x, y, z
u, v = np.pi/4, np.pi/3
x, y, z = ellipsoid_surface(u, v)
print(f"Point on ellipsoid surface: ({x:.2f}, {y:.2f}, {z:.2f})")
Output:
Point on ellipsoid surface: (0.71, 1.84, 2.83)
This output shows a point on the ellipsoid surface generated using the parametric equations.
Create meshgrid for parameterization
To create a smooth surface, you’ll need to generate a meshgrid of u and v values:
u = np.linspace(0, np.pi, 30)
v = np.linspace(0, 2 * np.pi, 60)
u, v = np.meshgrid(u, v)
print(f"Shape of u: {u.shape}")
print(f"Shape of v: {v.shape}")
Output:
Shape of u: (60, 30)
Shape of v: (60, 30)
The output shows the shapes of the meshgrid arrays, which will be used to generate the ellipsoid surface points.
Calculate x, y, and z coordinates
Now, calculate the x, y, and z coordinates using the meshgrid:
x, y, z = ellipsoid_surface(u, v)
print(f"Shape of x: {x.shape}")
print(f"Shape of y: {y.shape}")
print(f"Shape of z: {z.shape}")
Output:
Shape of x: (60, 30)
Shape of y: (60, 30)
Shape of z: (60, 30)
These shapes correspond to the surface points of the ellipsoid, ready for plotting.
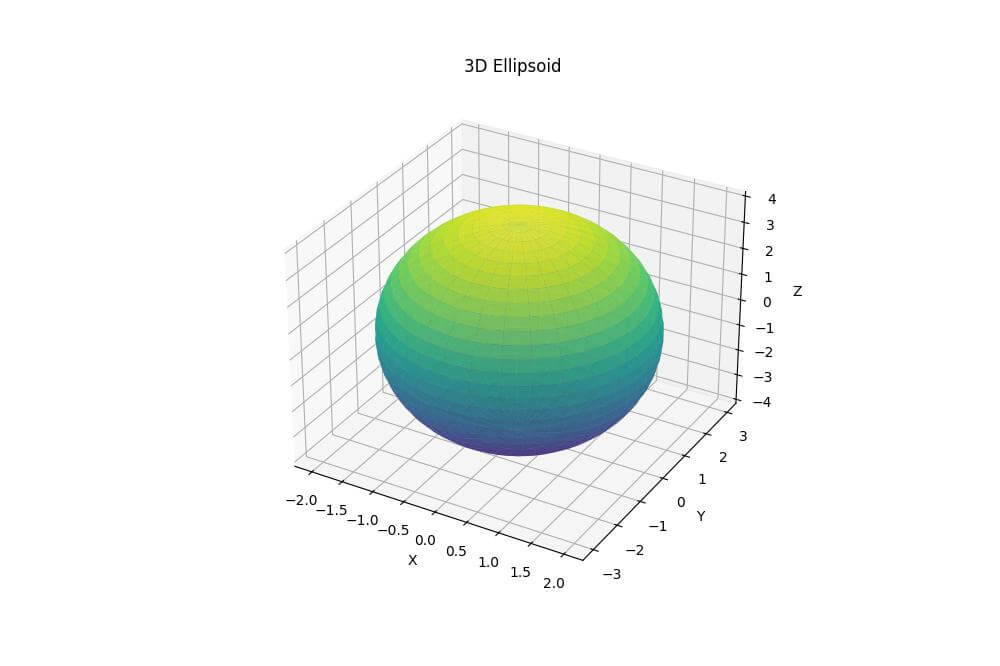
Plot with Matplotlib
To create a 3D plot of the ellipsoid using Matplotlib, you can use the following code:
import matplotlib.pyplot as plt
fig = plt.figure(figsize=(10, 8))
ax = fig.add_subplot(111, projection='3d')
ax.plot_surface(x, y, z, cmap='viridis', alpha=0.8)
ax.set_xlabel('X')
ax.set_ylabel('Y')
ax.set_zlabel('Z')
ax.set_title('3D Ellipsoid')
plt.show()
Output:
Handle Multiple Ellipsoids
To plot multiple overlapping ellipsoids, you can create separate surface plots for each ellipsoid:
import numpy as np
import matplotlib.pyplot as plt
from mpl_toolkits.mplot3d import Axes3D
def ellipsoid(center, radii, rotation, num_points=100):
    u = np.linspace(0, 2 * np.pi, num_points)
    v = np.linspace(0, np.pi, num_points)
    x = radii[0] * np.outer(np.cos(u), np.sin(v))
    y = radii[1] * np.outer(np.sin(u), np.sin(v))
    z = radii[2] * np.outer(np.ones_like(u), np.cos(v))
    for i in range(len(x)):
        for j in range(len(x)):
            [x[i,j], y[i,j], z[i,j]] = np.dot([x[i,j], y[i,j], z[i,j]], rotation) + center
    return x, y, z
fig = plt.figure(figsize=(10, 8))
ax = fig.add_subplot(111, projection='3d')

# Define ellipsoids
ellipsoids = [
    {"center": [0, 0, 0], "radii": [3, 2, 1], "rotation": np.eye(3), "color": 'r', "alpha": 0.8},
  {"center": [2, 2, 2], "radii": [2, 3, 1.5], "rotation": np.array([[0.8, -0.6, 0], [0.6, 0.8, 0], [0, 0, 1]]), "color": 'b', "alpha": 0.8},
  {"center": [-1, 1, -1], "radii": [1.5, 1.5, 2], "rotation": np.array([[1, 0, 0], [0, 0.7, -0.7], [0, 0.7, 0.7]]), "color": 'g', "alpha": 0.8}
]
for e in ellipsoids:
    x, y, z = ellipsoid(e["center"], e["radii"], e["rotation"])
    ax.plot_surface(x, y, z, color=e["color"], alpha=e["alpha"])
ax.set_xlabel('X')
ax.set_ylabel('Y')
ax.set_zlabel('Z')
ax.set_title('Multiple Overlapping Ellipsoids')
ax.set_box_aspect((np.ptp(ax.get_xlim()), np.ptp(ax.get_ylim()), np.ptp(ax.get_zlim())))
plt.show()
Output:
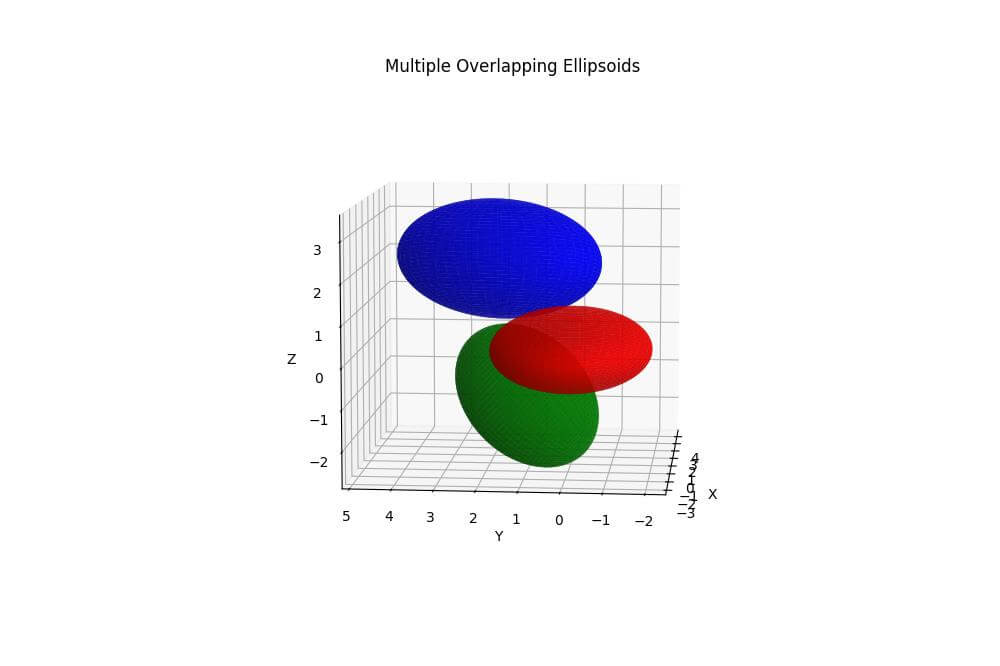
This code will generate a plot with three overlapping ellipsoids.
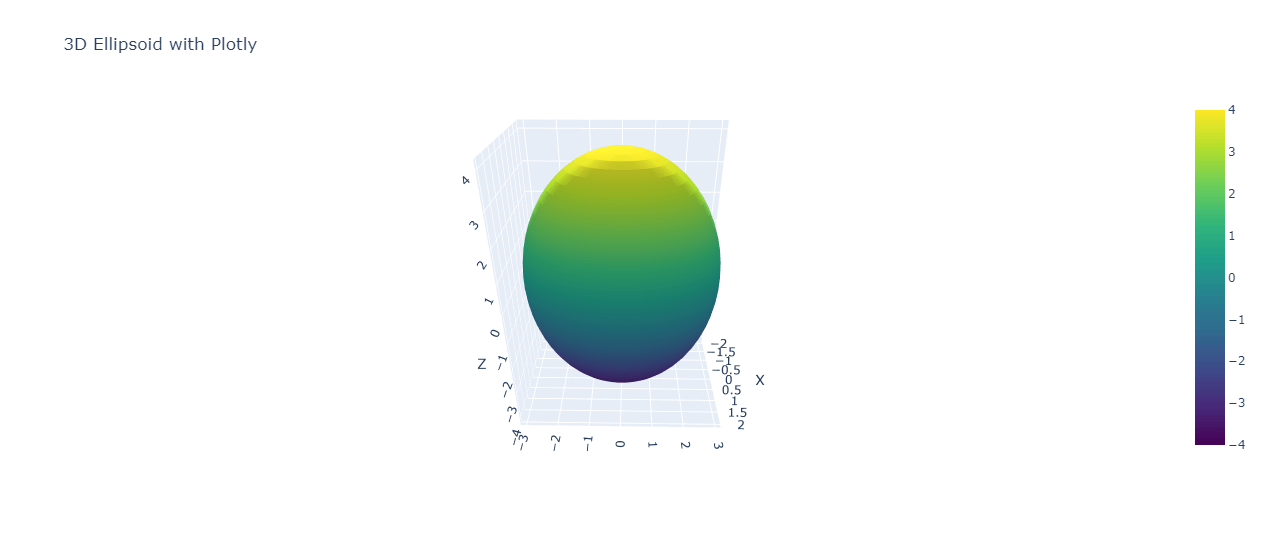
Plot with Plotly
For interactive 3D plots, you can use Plotly. Here’s how to create an ellipsoid plot with Plotly:
import plotly.graph_objects as go
fig = go.Figure(data=[go.Surface(x=x, y=y, z=z, colorscale='viridis')])
fig.update_layout(title='3D Ellipsoid with Plotly',
                  scene=dict(xaxis_title='X',
                             yaxis_title='Y',
                             zaxis_title='Z'))
fig.show()
Output:
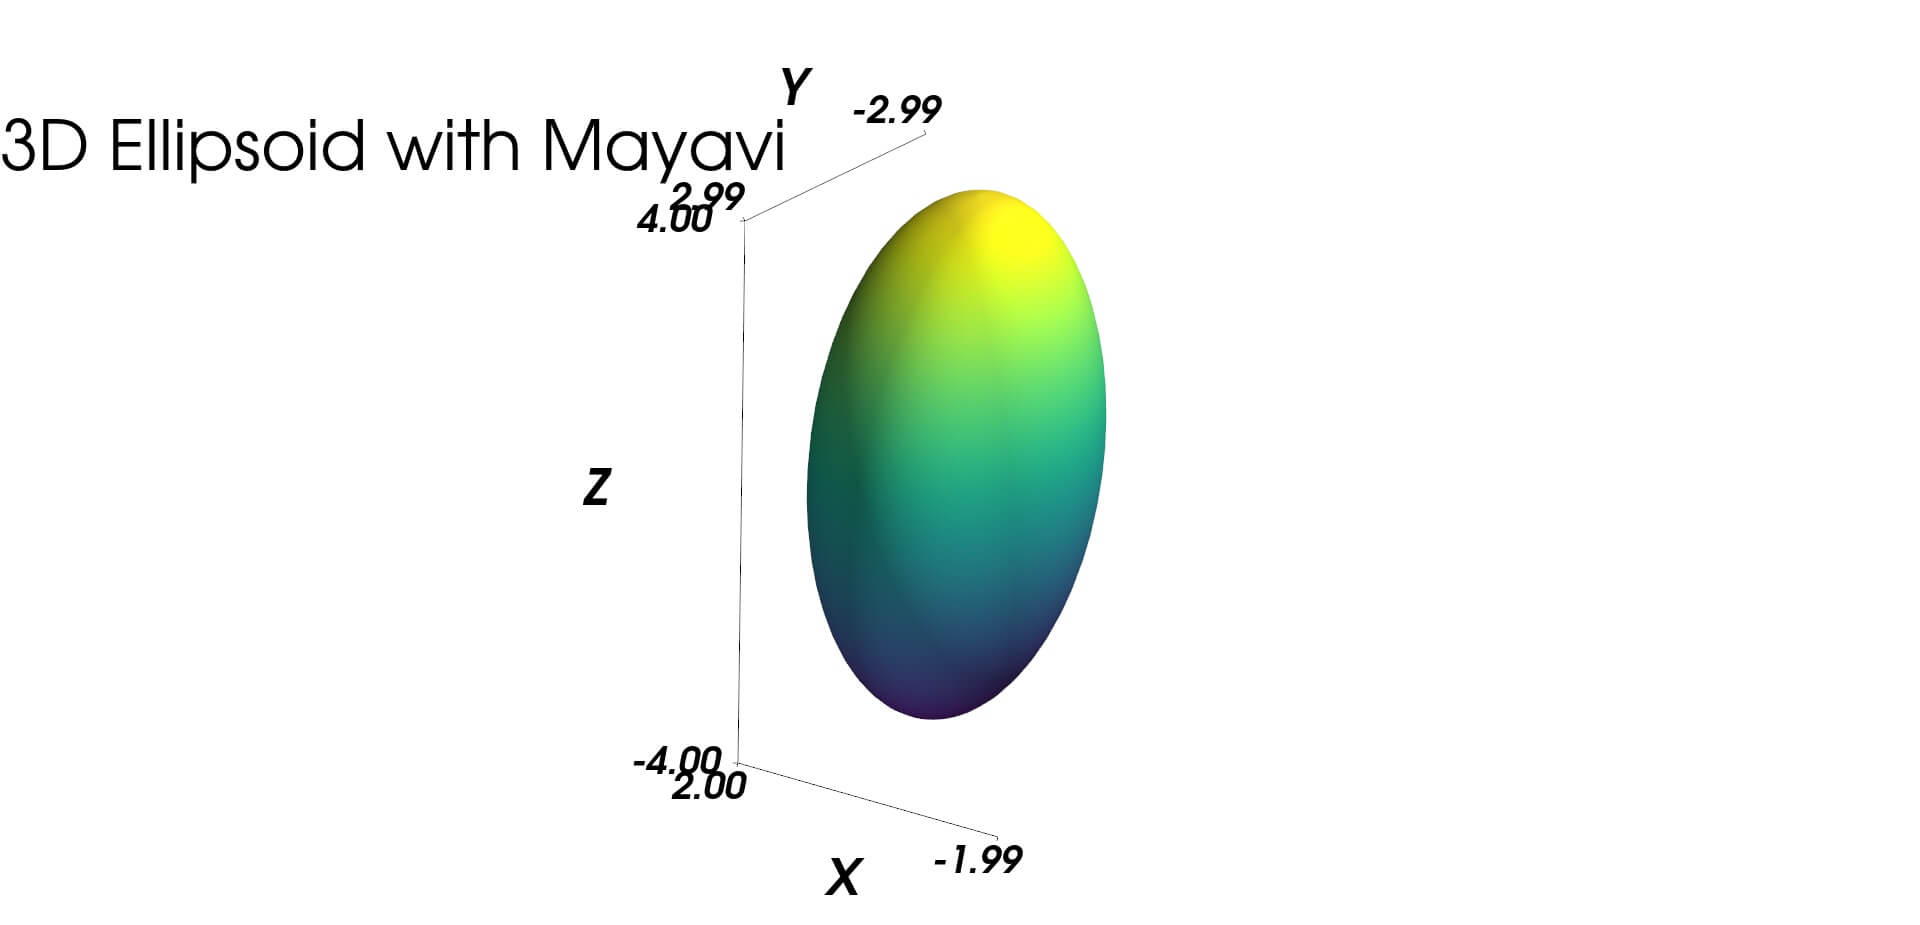
Plot with Mayavi
For high-quality 3D visualization, you can use Mayavi. Here’s how to create an ellipsoid plot with Mayavi:
from mayavi import mlab
mlab.figure(bgcolor=(1, 1, 1), fgcolor=(0, 0, 0), size=(800, 600))
mlab.mesh(x, y, z, colormap='viridis')
mlab.axes(xlabel='X', ylabel='Y', zlabel='Z')
mlab.title('3D Ellipsoid with Mayavi')
mlab.show()
Output:
Mokhtar is the founder of LikeGeeks.com. He is a seasoned technologist and accomplished author, with expertise in Linux system administration and Python development. Since 2010, Mokhtar has built an impressive career, transitioning from system administration to Python development in 2015. His work spans large corporations to freelance clients around the globe. Alongside his technical work, Mokhtar has authored some insightful books in his field. Known for his innovative solutions, meticulous attention to detail, and high-quality work, Mokhtar continually seeks new challenges within the dynamic field of technology.