Swap Axes in Python 3D plots using Matplotlib
In this tutorial, you’ll learn how to swap axes in Python 3D plots using various methods.
These methods will help you visualize your 3D data from different perspectives.
You’ll use Matplotlib to create and modify 3D plot axes.
Swap Data Inputs
The simplest way to swap axes in a 3D plot is to change the order of data inputs when creating the plot.
To create a basic 3D scatter plot, you can use the following code:
import numpy as np
import matplotlib.pyplot as plt
x = np.random.rand(100)
y = np.random.rand(100)
z = np.random.rand(100)
fig = plt.figure(figsize=(10, 5))

# Original plot
ax1 = fig.add_subplot(121, projection='3d')
ax1.scatter(x, y, z)
ax1.set_xlabel('X')
ax1.set_ylabel('Y')
ax1.set_zlabel('Z')
ax1.set_title('Original')

# Swapped axes plot
ax2 = fig.add_subplot(122, projection='3d')
ax2.scatter(y, z, x)
ax2.set_xlabel('Y')
ax2.set_ylabel('Z')
ax2.set_zlabel('X')
ax2.set_title('Swapped (Y, Z, X)')
plt.tight_layout()
plt.show()
Output:
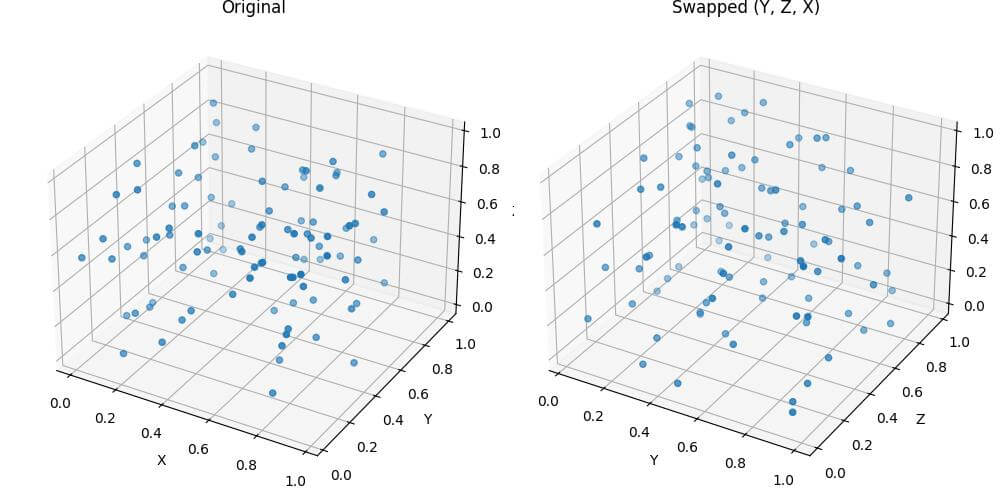
This code creates two 3D scatter plots: one with the original data order (x, y, z) and another with swapped axes (y, z, x).
The axis labels are adjusted accordingly to reflect the new order.
Using ax.invert_axis()
You can use the invert_xaxis(), invert_yaxis(), and invert_zaxis() methods to flip the direction of individual axes.
To invert axes in your 3D plot, use this code:
import numpy as np
import matplotlib.pyplot as plt
x = np.linspace(-5, 5, 20)
y = np.linspace(-5, 5, 20)
X, Y = np.meshgrid(x, y)
Z = np.sin(np.sqrt(X**2 + Y**2))
fig = plt.figure(figsize=(15, 5))

# Original plot
ax1 = fig.add_subplot(131, projection='3d')
ax1.plot_surface(X, Y, Z, cmap='viridis')
ax1.set_title('Original')

# Invert X and Y axes
ax2 = fig.add_subplot(132, projection='3d')
ax2.plot_surface(X, Y, Z, cmap='viridis')
ax2.invert_xaxis()
ax2.invert_yaxis()
ax2.set_title('Inverted X and Y axes')

# Invert all axes
ax3 = fig.add_subplot(133, projection='3d')
ax3.plot_surface(X, Y, Z, cmap='viridis')
ax3.invert_xaxis()
ax3.invert_yaxis()
ax3.invert_zaxis()
ax3.set_title('Inverted all axes')
plt.tight_layout()
plt.show()
Output:
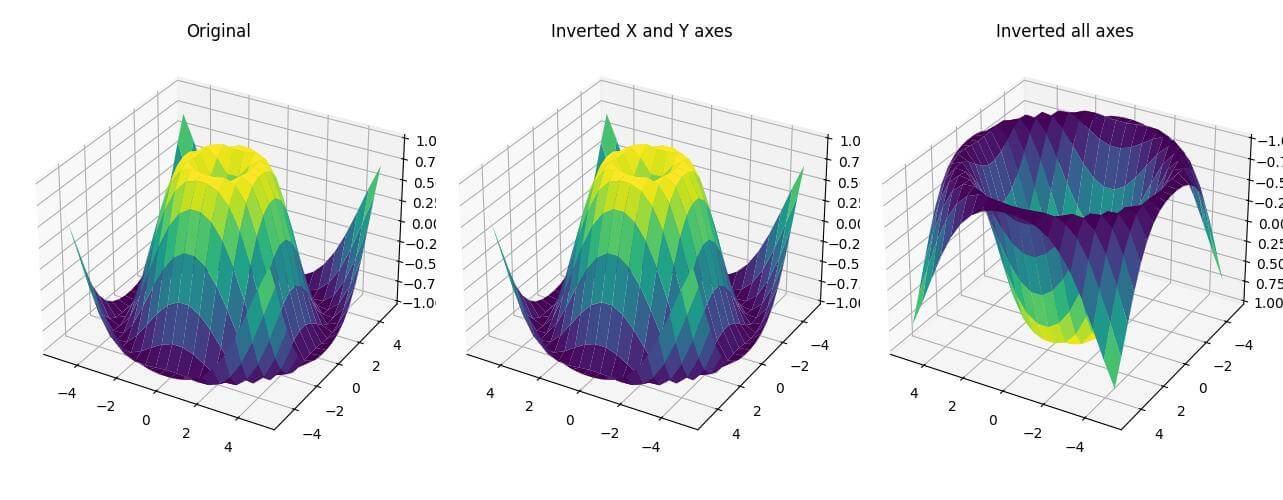
This code shows how to invert individual axes or all axes simultaneously.
Using swapaxes Method
For NumPy arrays, you can use the swapaxes() method to interchange axes before plotting.
To swap axes using the swapaxes() method, use this code:
import numpy as np
import matplotlib.pyplot as plt
from mpl_toolkits.mplot3d import Axes3D
x = np.linspace(-5, 5, 20)
y = np.linspace(-5, 5, 20)
z = np.linspace(-5, 5, 20)
X, Y, Z = np.meshgrid(x, y, z)
data = np.sin(np.sqrt(X**2 + Y**2 + Z**2))
fig = plt.figure(figsize=(12, 5))

# Original data plot
ax1 = fig.add_subplot(121, projection='3d')
scatter1 = ax1.scatter(X, Y, Z, c=data, cmap='viridis')
ax1.set_title('Original Data')
ax1.set_xlabel('X axis')
ax1.set_ylabel('Y axis')
ax1.set_zlabel('Z axis')

# Swap axes (X and Z)
swapped_data = data.swapaxes(0, 2)
swapped_X = X.swapaxes(0, 2)
swapped_Y = Y.swapaxes(0, 2)
swapped_Z = Z.swapaxes(0, 2)

# Swapped data plot
ax2 = fig.add_subplot(122, projection='3d')
scatter2 = ax2.scatter(swapped_X, swapped_Y, swapped_Z, c=swapped_data, cmap='viridis')
ax2.set_title('Swapped Data (X and Z axes)')
ax2.set_xlabel('Z axis (swapped)')
ax2.set_ylabel('Y axis')
ax2.set_zlabel('X axis (swapped)')
plt.tight_layout()
plt.show()
Output:
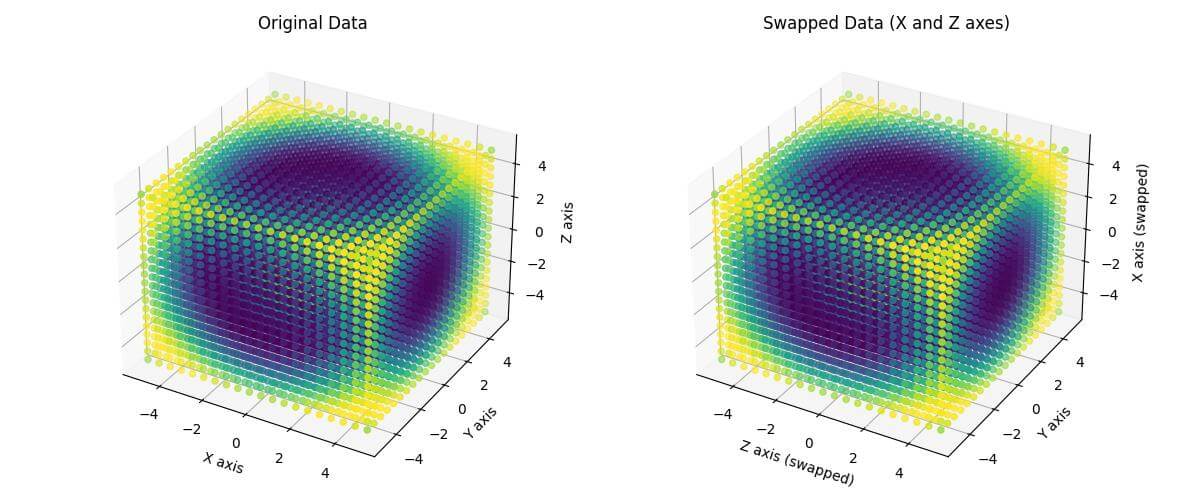
The swapaxes() method allows you to interchange the axes of NumPy arrays which changes the orientation of your 3D data before plotting.
Mokhtar is the founder of LikeGeeks.com. He is a seasoned technologist and accomplished author, with expertise in Linux system administration and Python development. Since 2010, Mokhtar has built an impressive career, transitioning from system administration to Python development in 2015. His work spans large corporations to freelance clients around the globe. Alongside his technical work, Mokhtar has authored some insightful books in his field. Known for his innovative solutions, meticulous attention to detail, and high-quality work, Mokhtar continually seeks new challenges within the dynamic field of technology.