Draw Vertical Lines in Python 3D Plot
In this tutorial, you’ll learn how to draw vertical lines in 3D plots using the Python Matplotlib library.
We’ll cover generating data points, plotting single and multiple vertical lines, and adding color gradients.
Generate Data Points for Vertical Lines
To create vertical lines in a 3D plot, you first need to generate the data points.
You can use NumPy to create arrays for the x, y, and z coordinates.
import numpy as np
import matplotlib.pyplot as plt
from mpl_toolkits.mplot3d import Axes3D

# Generate data points for a vertical line
x = np.array([2])
y = np.array([3])
z = np.linspace(0, 10, 100)
print(f"x: {x}")
print(f"y: {y}")
print(f"z: {z[:5]}...")
Output:
x: [2]
y: [3]
z: [0.        0.1010101 0.2020202 0.3030303 0.4040404]...
The x and y coordinates are fixed, while z varies from 0 to 10 with 100 points.
Using plot3D()
You can use the plot3D() function from Matplotlib to draw a vertical line in a 3D plot.
Here’s how to create a simple vertical line:
fig = plt.figure(figsize=(10, 8))
ax = fig.add_subplot(111, projection='3d')
ax.plot3D(x, y, z, 'r-')
ax.set_xlabel('X-axis')
ax.set_ylabel('Y-axis')
ax.set_zlabel('Z-axis')
ax.set_title('Vertical Line in 3D Plot')
plt.show()
Output:
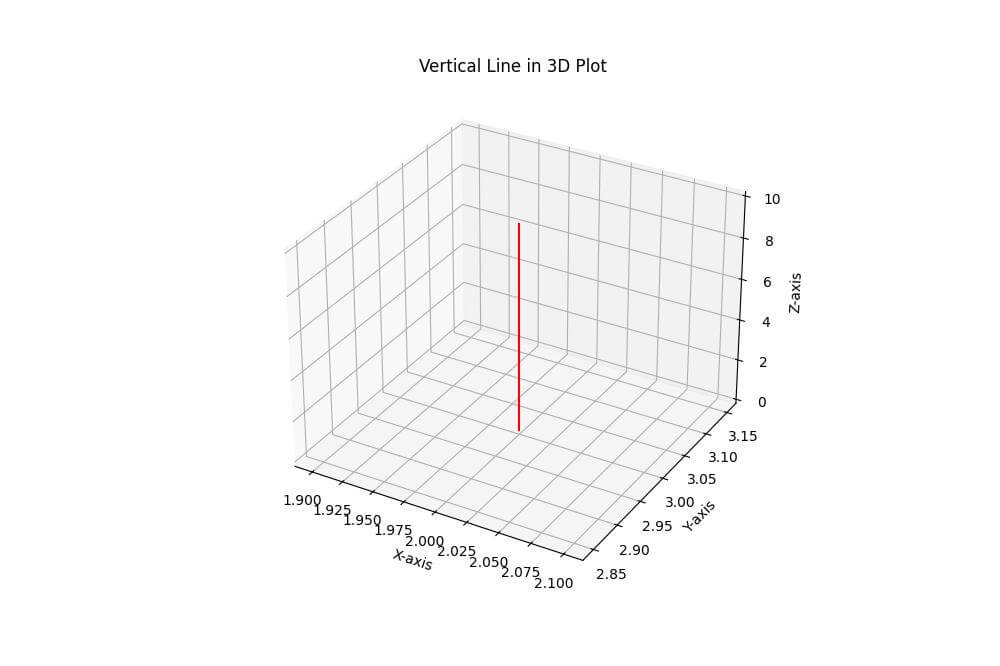
The plot shows a red vertical line starting at (2, 3, 0) and ending at (2, 3, 10).
Draw multiple vertical lines
To draw multiple vertical lines, you can create arrays with multiple x and y coordinates.
Here’s how to draw three vertical lines:
x = np.array([1, 3, 5])
y = np.array([2, 4, 6])
z = np.linspace(0, 10, 100)
fig = plt.figure(figsize=(10, 8))
ax = fig.add_subplot(111, projection='3d')
for i in range(len(x)):
    ax.plot3D([x[i]] * len(z), [y[i]] * len(z), z, '-')
ax.set_xlabel('X-axis')
ax.set_ylabel('Y-axis')
ax.set_zlabel('Z-axis')
ax.set_title('Multiple Vertical Lines in 3D Plot')
plt.show()
Output:
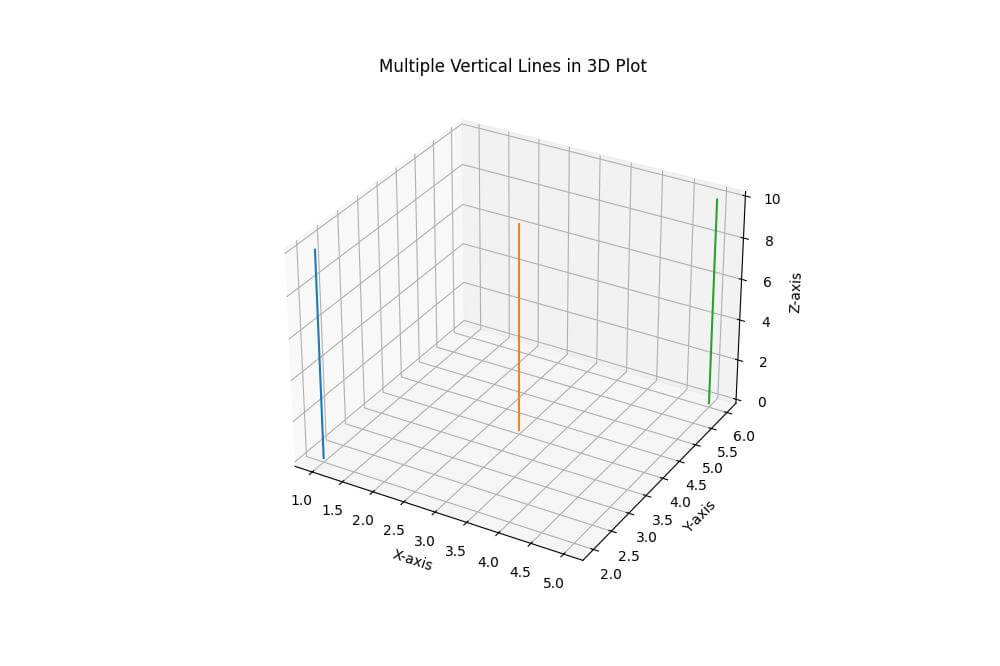
The plot displays three vertical lines at different x and y positions, each extending from z=0 to z=10.
Add a color gradient to vertical lines
You can enhance the visual appeal of your vertical lines by adding a color gradient.
Use a colormap to do this effect:
x = np.array([2, 4, 6])
y = np.array([3, 5, 7])
z = np.linspace(0, 10, 100)
fig = plt.figure(figsize=(10, 8))
ax = fig.add_subplot(111, projection='3d')
for i in range(len(x)):
    colors = plt.cm.viridis(z / 10)
    ax.scatter3D([x[i]] * len(z), [y[i]] * len(z), z, c=colors, s=10)
ax.set_xlabel('X-axis')
ax.set_ylabel('Y-axis')
ax.set_zlabel('Z-axis')
ax.set_title('Vertical Lines with Color Gradient in 3D Plot')
plt.show()
Output:
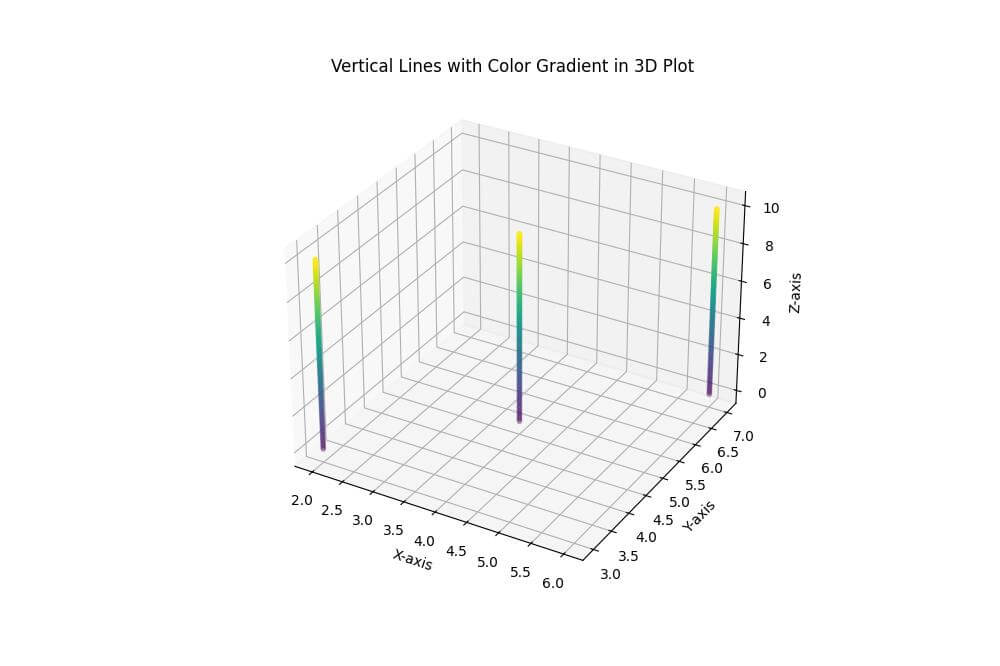
The plot shows three vertical lines using scattered points, with colors transitioning from blue at the bottom to yellow at the top.
Mokhtar is the founder of LikeGeeks.com. He is a seasoned technologist and accomplished author, with expertise in Linux system administration and Python development. Since 2010, Mokhtar has built an impressive career, transitioning from system administration to Python development in 2015. His work spans large corporations to freelance clients around the globe. Alongside his technical work, Mokhtar has authored some insightful books in his field. Known for his innovative solutions, meticulous attention to detail, and high-quality work, Mokhtar continually seeks new challenges within the dynamic field of technology.