3D Voxel Plots in Python Using Matplotlib
In this tutorial, you’ll learn how to create 3D voxel plots using Python and Matplotlib.
Voxel plots are an excellent way to visualize three-dimensional data, especially when dealing with discrete volumetric information.
Understand 3D voxel data
Voxels are the 3D equivalent of pixels, representing volumetric data points in a three-dimensional grid.
Each voxel occupies a specific position in 3D space and can have associated properties such as color, opacity, or other data values.
To create a simple 3D voxel grid, you can use NumPy to generate a boolean array:
import numpy as np
import matplotlib.pyplot as plt
voxel_grid = np.zeros((5, 5, 5), dtype=bool)
voxel_grid[1:4, 1:4, 1:4] = True
fig = plt.figure()
ax = fig.add_subplot(111, projection='3d')
ax.voxels(voxel_grid)
plt.show()
Output:
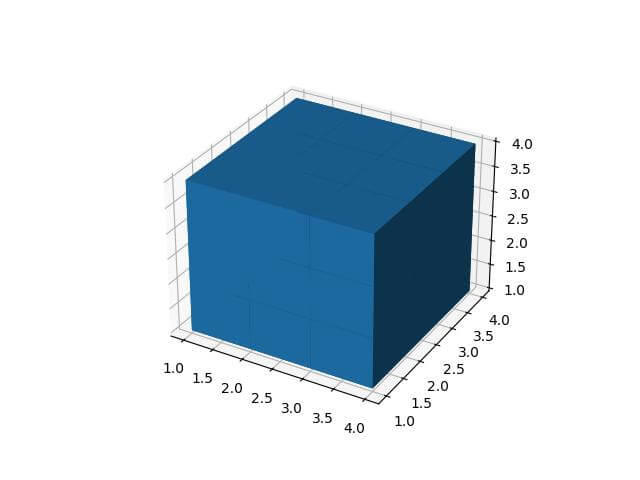
This code creates a 5x5x5 grid with a 3x3x3 cube of voxels in the center.
Data Structures for Voxel Storage
For more complex voxel data, you need to use different data structures.
NumPy arrays are efficient for regular grids, but for sparse voxel data, you can use dictionaries or specialized data structures like octrees.
Here’s an example of using a dictionary to store sparse voxel data:
import numpy as np
import matplotlib.pyplot as plt
voxel_dict = {(1, 1, 1): True, (2, 2, 2): True, (3, 3, 3): True}

# Convert the dictionary to a 3D array
grid_size = 5
voxel_grid = np.zeros((grid_size, grid_size, grid_size), dtype=bool)
for coord, value in voxel_dict.items():
    voxel_grid[coord] = value
fig = plt.figure()
ax = fig.add_subplot(111, projection='3d')
ax.voxels(voxel_grid)
plt.show()
Output:
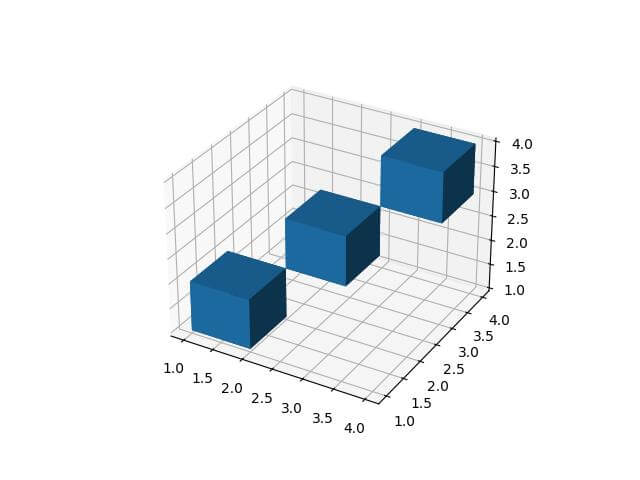
This code creates a sparse voxel representation using a dictionary and then converts it to a 3D NumPy array for plotting.
Customize Voxel Appearance
Adjust edge colors and visibility
You can customize your voxel plot by adjusting edge colors and visibility:
import numpy as np
import matplotlib.pyplot as plt
voxel_array = np.zeros((5, 5, 5), dtype=bool)
voxel_array[1:4, 1:4, 1:4] = True
fig = plt.figure()
ax = fig.add_subplot(111, projection='3d')
ax.voxels(voxel_array, edgecolor='black', facecolors='#1f77b4', alpha=0.9)
plt.show()
Output:
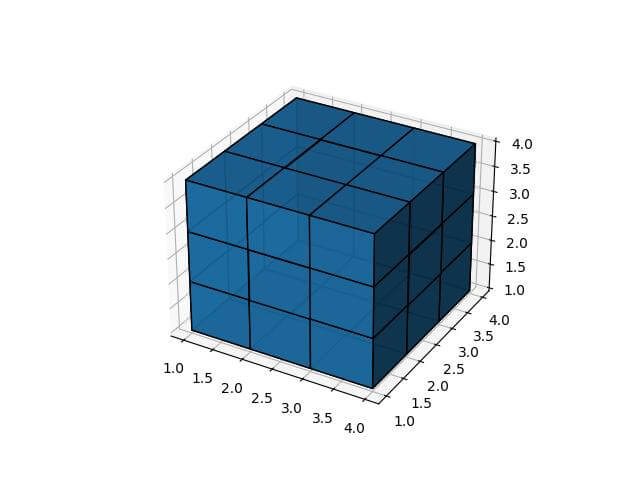
This code sets the edge color to black and the face color to a light blue. The resulting plot shows a cube with distinct black edges.
Apply Different Colors to each face
You can apply different colors to each face of the voxels:
import numpy as np
import matplotlib.pyplot as plt
def create_colormap(voxel_array):
    color_map = np.empty(voxel_array.shape + (3,), dtype=float)
    color_map[..., 0] = np.linspace(0, 1, voxel_array.shape[0])[:, np.newaxis, np.newaxis]
    color_map[..., 1] = np.linspace(0, 1, voxel_array.shape[1])[np.newaxis, :, np.newaxis]
    color_map[..., 2] = np.linspace(0, 1, voxel_array.shape[2])[np.newaxis, np.newaxis, :]
    return color_map
voxel_array = np.ones((5, 5, 5), dtype=bool)
colors = create_colormap(voxel_array)
fig = plt.figure()
ax = fig.add_subplot(111, projection='3d')
ax.voxels(voxel_array, facecolors=colors, edgecolor='k')
plt.show()
Output:
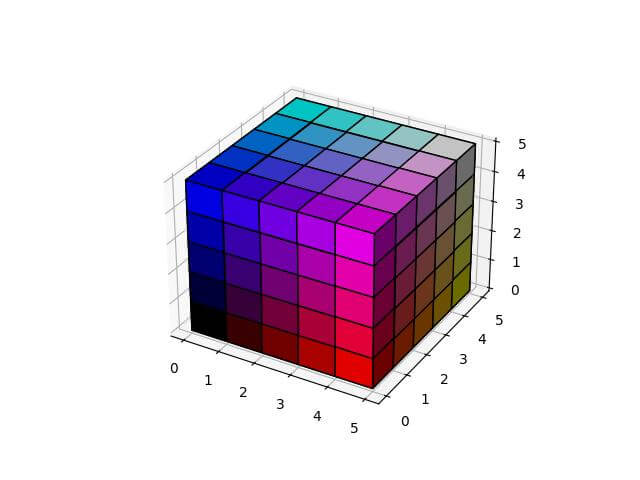
This code creates a color gradient across the voxel grid, with each face having a unique color based on its position.
Create Non-cubic Voxels
You can create non-cubic voxels by specifying different spacings for each dimension:
import numpy as np
import matplotlib.pyplot as plt
voxel_array = np.zeros((4, 3, 2), dtype=bool)
voxel_array[0, 0, 0] = True
voxel_array[1, 1, 0] = True
voxel_array[2, 2, 1] = True
voxel_array[3, 1, 1] = True
fig = plt.figure()
ax = fig.add_subplot(111, projection='3d')
ax.voxels(voxel_array, edgecolor='k')
ax.set_box_aspect((4, 3, 2))  # Set the aspect ratio to match the voxel dimensions
plt.show()
Output:
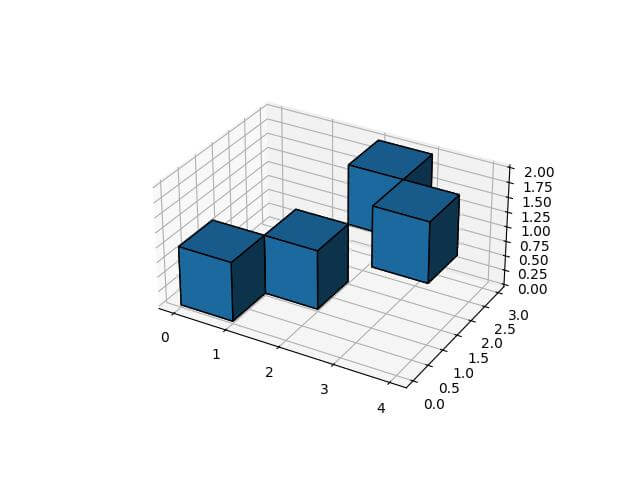
This code creates a 4x3x2 grid with non-cubic voxels. The resulting plot shows elongated voxels that reflect the different spacings in each dimension.
Mokhtar is the founder of LikeGeeks.com. He is a seasoned technologist and accomplished author, with expertise in Linux system administration and Python development. Since 2010, Mokhtar has built an impressive career, transitioning from system administration to Python development in 2015. His work spans large corporations to freelance clients around the globe. Alongside his technical work, Mokhtar has authored some insightful books in his field. Known for his innovative solutions, meticulous attention to detail, and high-quality work, Mokhtar continually seeks new challenges within the dynamic field of technology.