Create 3D Plots with Sliders in Python For Interactivity
Creating interactive 3D plots in Python can enhance data visualization.
By using sliders, you can dynamically adjust various parameters of your plots.
In this tutorial, you’ll learn how to create 3D plots with sliders to make them interactive.
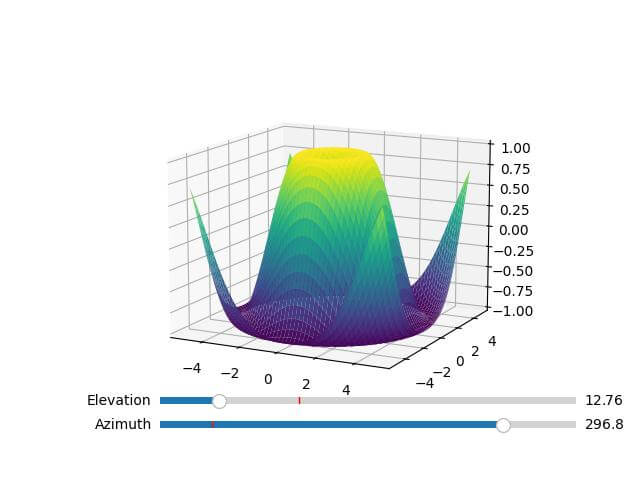
Dynamic Viewing Angle
To adjust the viewing angle of a 3D plot, use sliders to control the azimuth and elevation.
import numpy as np
import matplotlib.pyplot as plt
from mpl_toolkits.mplot3d import Axes3D
from matplotlib.widgets import Slider
x = np.linspace(-5, 5, 100)
y = np.linspace(-5, 5, 100)
x, y = np.meshgrid(x, y)
z = np.sin(np.sqrt(x**2 + y**2))
fig = plt.figure()
ax = fig.add_subplot(111, projection='3d')
plot = ax.plot_surface(x, y, z, cmap='viridis')

# Add sliders for azimuth and elevation
ax_azimuth = plt.axes([0.25, 0.1, 0.65, 0.03])
ax_elevation = plt.axes([0.25, 0.15, 0.65, 0.03])
slider_azimuth = Slider(ax_azimuth, 'Azimuth', 0, 360, valinit=45)
slider_elevation = Slider(ax_elevation, 'Elevation', 0, 90, valinit=30)
def update(val):
    ax.view_init(elev=slider_elevation.val, azim=slider_azimuth.val)
    fig.canvas.draw_idle()
slider_azimuth.on_changed(update)
slider_elevation.on_changed(update)
plt.show()
Output:
Control Data Parameters
You can use sliders to modify the amplitude and frequency of a surface plot:
import numpy as np
import matplotlib.pyplot as plt
from mpl_toolkits.mplot3d import Axes3D
from matplotlib.widgets import Slider
x = np.linspace(0, 10, 100)
y = np.linspace(0, 10, 100)
x, y = np.meshgrid(x, y)
fig = plt.figure()
ax = fig.add_subplot(111, projection='3d')
z = np.sin(x) * np.cos(y)
plot = ax.plot_surface(x, y, z, cmap='viridis')

# Add sliders for amplitude and frequency
ax_amp = plt.axes([0.25, 0.1, 0.65, 0.03])
ax_freq = plt.axes([0.25, 0.15, 0.65, 0.03])
slider_amp = Slider(ax_amp, 'Amplitude', 0.1, 2.0, valinit=1.0)
slider_freq = Slider(ax_freq, 'Frequency', 0.1, 2.0, valinit=1.0)
def update(val):
    z = slider_amp.val * np.sin(slider_freq.val * x) * np.cos(slider_freq.val * y)
    ax.clear()
    ax.plot_surface(x, y, z, cmap='viridis')
    fig.canvas.draw_idle()
slider_amp.on_changed(update)
slider_freq.on_changed(update)
plt.show()
Output:
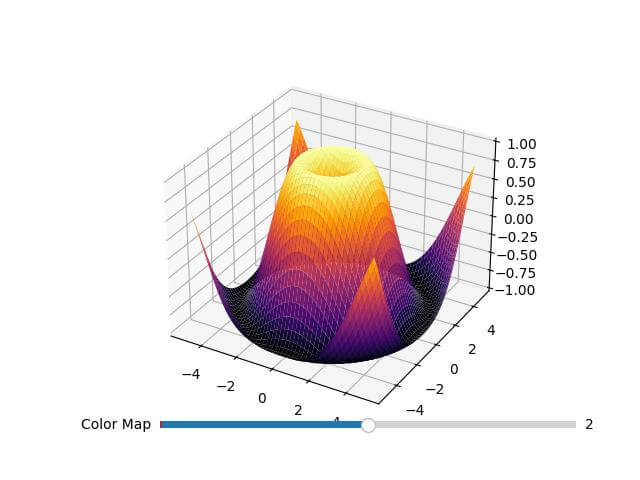
Modify Color Map
To change the color map of a 3D surface plot, you can use a slider to select different color maps.
import numpy as np
import matplotlib.pyplot as plt
from mpl_toolkits.mplot3d import Axes3D
from matplotlib.widgets import Slider
x = np.linspace(-5, 5, 100)
y = np.linspace(-5, 5, 100)
x, y = np.meshgrid(x, y)
z = np.sin(np.sqrt(x**2 + y**2))
fig = plt.figure()
ax = fig.add_subplot(111, projection='3d')
plot = ax.plot_surface(x, y, z, cmap='viridis')

# Add slider for color map
ax_cmap = plt.axes([0.25, 0.1, 0.65, 0.03])
cmap_list = ['viridis', 'plasma', 'inferno', 'magma', 'cividis']
slider_cmap = Slider(ax_cmap, 'Color Map', 0, len(cmap_list) - 1, valinit=0, valstep=1)
def update(val):
    ax.clear()
    ax.plot_surface(x, y, z, cmap=cmap_list[int(slider_cmap.val)])
    fig.canvas.draw_idle()
slider_cmap.on_changed(update)
plt.show()
Output:
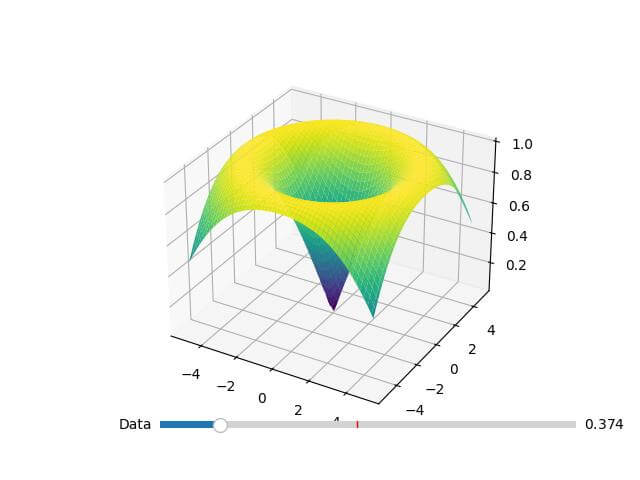
Interactive Plot Updates
Use sliders to interactively update the data in your plot and observe real-time changes.
import numpy as np
import matplotlib.pyplot as plt
from mpl_toolkits.mplot3d import Axes3D
from matplotlib.widgets import Slider
x = np.linspace(-5, 5, 100)
y = np.linspace(-5, 5, 100)
x, y = np.meshgrid(x, y)
z = np.sin(np.sqrt(x**2 + y**2))
fig = plt.figure()
ax = fig.add_subplot(111, projection='3d')
plot = ax.plot_surface(x, y, z, cmap='viridis')

# Add slider for data update
ax_data = plt.axes([0.25, 0.1, 0.65, 0.03])
slider_data = Slider(ax_data, 'Data', 0.1, 2.0, valinit=1.0)
def update(val):
    z = np.sin(slider_data.val * np.sqrt(x**2 + y**2))
    ax.clear()
    ax.plot_surface(x, y, z, cmap='viridis')
    fig.canvas.draw_idle()
slider_data.on_changed(update)
plt.show()
Output:
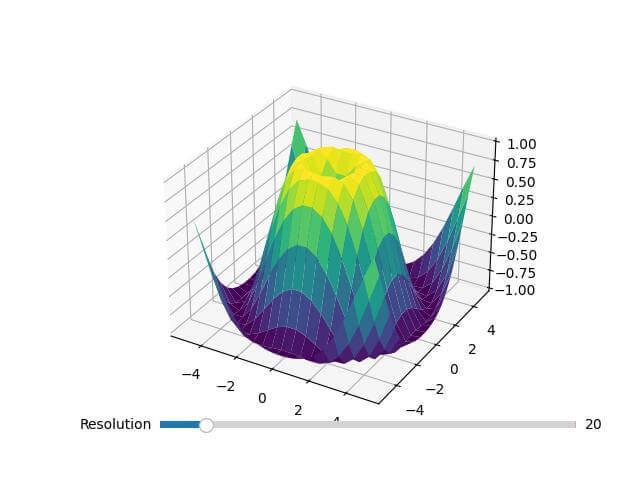
Control Surface Plot Resolution
You can dynamically change the resolution of a 3D surface plot using a slider.
import numpy as np
import matplotlib.pyplot as plt
from mpl_toolkits.mplot3d import Axes3D
from matplotlib.widgets import Slider
x = np.linspace(-5, 5, 100)
y = np.linspace(-5, 5, 100)
x, y = np.meshgrid(x, y)
z = np.sin(np.sqrt(x**2 + y**2))
fig = plt.figure()
ax = fig.add_subplot(111, projection='3d')
plot = ax.plot_surface(x, y, z, cmap='viridis')

# Add slider for resolution
ax_res = plt.axes([0.25, 0.1, 0.65, 0.03])
slider_res = Slider(ax_res, 'Resolution', 10, 100, valinit=100, valstep=10)
def update(val):
    x = np.linspace(-5, 5, int(slider_res.val))
    y = np.linspace(-5, 5, int(slider_res.val))
    x, y = np.meshgrid(x, y)
    z = np.sin(np.sqrt(x**2 + y**2))
    ax.clear()
    ax.plot_surface(x, y, z, cmap='viridis')
    fig.canvas.draw_idle()
slider_res.on_changed(update)
plt.show()
Output:
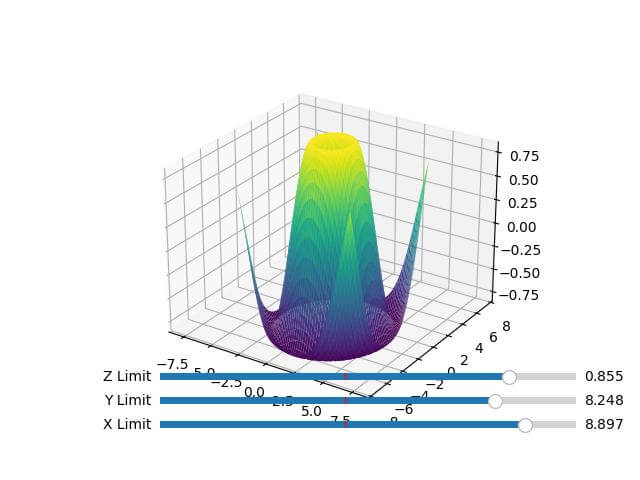
Adjust Plot Limits
You can use sliders to dynamically change the limits of the x, y, and z axes:
import numpy as np
import matplotlib.pyplot as plt
from mpl_toolkits.mplot3d import Axes3D
from matplotlib.widgets import Slider
x = np.linspace(-5, 5, 100)
y = np.linspace(-5, 5, 100)
x, y = np.meshgrid(x, y)
z = np.sin(np.sqrt(x**2 + y**2))
fig = plt.figure()
ax = fig.add_subplot(111, projection='3d')
plot = ax.plot_surface(x, y, z, cmap='viridis')

# Add sliders for axis limits
ax_xlim = plt.axes([0.25, 0.1, 0.65, 0.03])
ax_ylim = plt.axes([0.25, 0.15, 0.65, 0.03])
ax_zlim = plt.axes([0.25, 0.2, 0.65, 0.03])
slider_xlim = Slider(ax_xlim, 'X Limit', 1, 10, valinit=5)
slider_ylim = Slider(ax_ylim, 'Y Limit', 1, 10, valinit=5)
slider_zlim = Slider(ax_zlim, 'Z Limit', 0.1, 1.0, valinit=0.5)
def update(val):
    ax.set_xlim([-slider_xlim.val, slider_xlim.val])
    ax.set_ylim([-slider_ylim.val, slider_ylim.val])
    ax.set_zlim([-slider_zlim.val, slider_zlim.val])
    fig.canvas.draw_idle()
slider_xlim.on_changed(update)
slider_ylim.on_changed(update)
slider_zlim.on_changed(update)
plt.show()
Output:
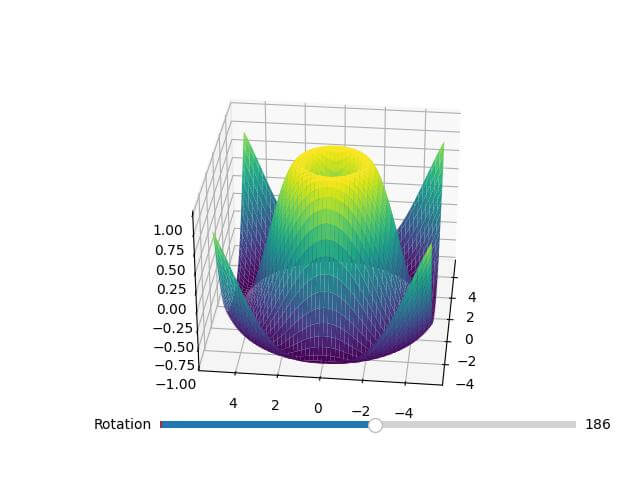
Interactive Plot Rotation
You can use sliders to rotate the plot around its center for a better view of the data:
import numpy as np
import matplotlib.pyplot as plt
from mpl_toolkits.mplot3d import Axes3D
from matplotlib.widgets import Slider
x = np.linspace(-5, 5, 100)
y = np.linspace(-5, 5, 100)
x, y = np.meshgrid(x, y)
z = np.sin(np.sqrt(x**2 + y**2))
fig = plt.figure()
ax = fig.add_subplot(111, projection='3d')
plot = ax.plot_surface(x, y, z, cmap='viridis')

# Add slider for rotation
ax_rot = plt.axes([0.25, 0.1, 0.65, 0.03])
slider_rot = Slider(ax_rot, 'Rotation', 0, 360, valinit=0)
def update(val):
    ax.view_init(elev=30, azim=slider_rot.val)
    fig.canvas.draw_idle()
slider_rot.on_changed(update)
plt.show()
Output:
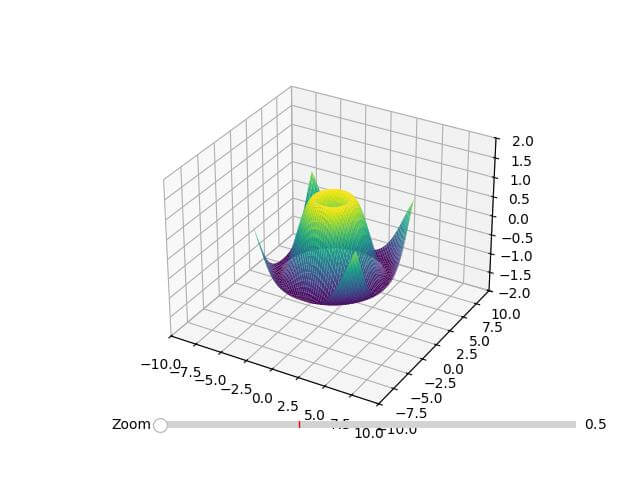
Interactive Plot Zoom
You can use sliders to zoom in and out of a 3D plot for detailed examination:
import numpy as np
import matplotlib.pyplot as plt
from mpl_toolkits.mplot3d import Axes3D
from matplotlib.widgets import Slider
x = np.linspace(-5, 5, 100)
y = np.linspace(-5, 5, 100)
x, y = np.meshgrid(x, y)
z = np.sin(np.sqrt(x**2 + y**2))
fig = plt.figure()
ax = fig.add_subplot(111, projection='3d')
plot = ax.plot_surface(x, y, z, cmap='viridis')

# Add slider for zoom
ax_zoom = plt.axes([0.25, 0.1, 0.65, 0.03])
slider_zoom = Slider(ax_zoom, 'Zoom', 0.5, 2.0, valinit=1.0)
def update(val):
    ax.set_xlim([-5/slider_zoom.val, 5/slider_zoom.val])
    ax.set_ylim([-5/slider_zoom.val, 5/slider_zoom.val])
    ax.set_zlim([-1/slider_zoom.val, 1/slider_zoom.val])
    fig.canvas.draw_idle()
slider_zoom.on_changed(update)
plt.show()
Output:
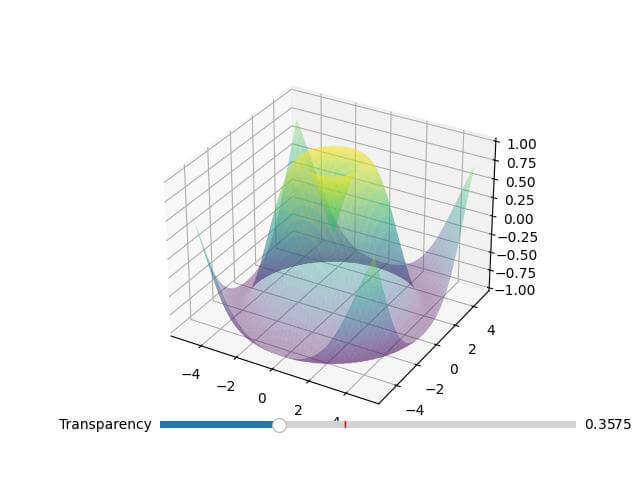
Adjust Plot Transparency
You can use a slider to adjust the transparency of the surface plot:
import numpy as np
import matplotlib.pyplot as plt
from mpl_toolkits.mplot3d import Axes3D
from matplotlib.widgets import Slider
x = np.linspace(-5, 5, 100)
y = np.linspace(-5, 5, 100)
x, y = np.meshgrid(x, y)
z = np.sin(np.sqrt(x**2 + y**2))
fig = plt.figure()
ax = fig.add_subplot(111, projection='3d')
plot = ax.plot_surface(x, y, z, cmap='viridis', alpha=0.5)

# Add slider for transparency
ax_alpha = plt.axes([0.25, 0.1, 0.65, 0.03])
slider_alpha = Slider(ax_alpha, 'Transparency', 0.1, 1.0, valinit=0.5)
def update(val):
    plot.set_alpha(slider_alpha.val)
    fig.canvas.draw_idle()
slider_alpha.on_changed(update)
plt.show()
Output:
Mokhtar is the founder of LikeGeeks.com. He is a seasoned technologist and accomplished author, with expertise in Linux system administration and Python development. Since 2010, Mokhtar has built an impressive career, transitioning from system administration to Python development in 2015. His work spans large corporations to freelance clients around the globe. Alongside his technical work, Mokhtar has authored some insightful books in his field. Known for his innovative solutions, meticulous attention to detail, and high-quality work, Mokhtar continually seeks new challenges within the dynamic field of technology.