Create 3D Plot from CSV File in Python
In this tutorial, you’ll learn how to create 3D plots from CSV data using Python.
You’ll start by reading data from a CSV file, and then preprocess it to handle any inconsistencies or outliers.
Finally, you’ll create a 3D plot.
Read Data from CSV
To begin, you’ll need to read your CSV file using pandas.
The sample CSV file is:
X,Y,Z
1,2,3
2,3,5
3,4,7
4,5,9
5,6,11
6,7,13
7,8,15
8,9,17
9,10,19
10,11,21
Here’s how you can do it:
import pandas as pd
df = pd.read_csv('sample_data.csv')
print(df.head())
   X  Y   Z
0  1  2   3
1  2  3   5
2  3  4   7
3  4  5   9
4  5  6  11
This code reads the CSV file and displays the first few rows of the dataframe.
To handle missing or malformed data, you can use pandas’ built-in functions:
df = df.dropna()

# Convert data types if necessary
df = df.astype({'X': float, 'Y': float, 'Z': float})

# Extract specific columns for 3D plotting
x = df['X']
y = df['Y']
z = df['Z']
print(x.head(), y.head(), z.head())
Output:
0    1.0
1    2.0
2    3.0
3    4.0
4    5.0
Name: X, dtype: float64 0    2.0
1    3.0
2    4.0
3    5.0
4    6.0
Name: Y, dtype: float64 0     3.0
1     5.0
2     7.0
3     9.0
4    11.0
Name: Z, dtype: float64
This code handles missing data, converts data types, and extracts specific columns for 3D plotting.
Data Preprocessing
To handle outliers and normalize your data, you can use the following code:
from scipy import stats
import numpy as np

# Remove outliers using Z-score
z_scores = np.abs(stats.zscore(df))
df_clean = df[(z_scores < 3).all(axis=1)]

# Normalize data
df_normalized = (df_clean - df_clean.min()) / (df_clean.max() - df_clean.min())
print(df_normalized.head())
Output:
          X         Y         Z
0  0.000000  0.000000  0.000000
1  0.111111  0.111111  0.111111
2  0.222222  0.222222  0.222222
3  0.333333  0.333333  0.333333
4  0.444444  0.444444  0.444444
This code removes outliers using Z-score and normalizes the data between 0 and 1.
Create 3D plot
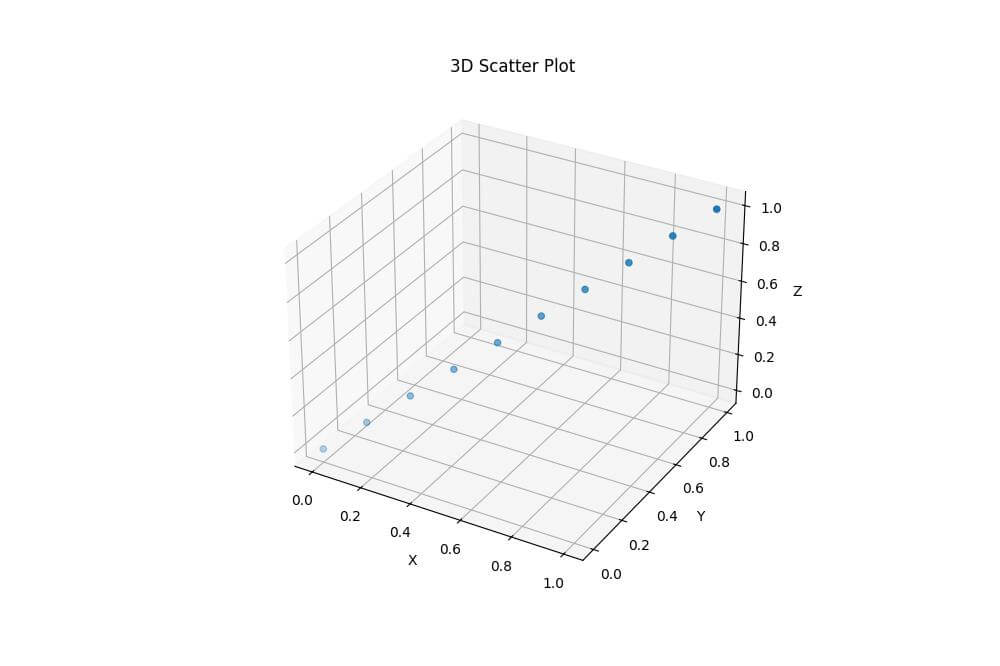
To create a 3D scatter plot, you can use matplotlib:
import matplotlib.pyplot as plt
from mpl_toolkits.mplot3d import Axes3D
fig = plt.figure(figsize=(10, 8))
ax = fig.add_subplot(111, projection='3d')
ax.scatter(df_normalized['X'], df_normalized['Y'], df_normalized['Z'])
ax.set_xlabel('X')
ax.set_ylabel('Y')
ax.set_zlabel('Z')
ax.set_title('3D Scatter Plot')
plt.show()
Output:
Mokhtar is the founder of LikeGeeks.com. He is a seasoned technologist and accomplished author, with expertise in Linux system administration and Python development. Since 2010, Mokhtar has built an impressive career, transitioning from system administration to Python development in 2015. His work spans large corporations to freelance clients around the globe. Alongside his technical work, Mokhtar has authored some insightful books in his field. Known for his innovative solutions, meticulous attention to detail, and high-quality work, Mokhtar continually seeks new challenges within the dynamic field of technology.