Customize 3D Plot Camera Angles in Python Matplotlib
In this tutorial, you’ll learn how to customize 3D plot camera angles using the Python Matplotlib library.
You’ll learn how to control the viewer’s perspective by adjusting azimuth and elevation angles and implementing interactive features that allow users to explore 3D plots in real time.
We’ll cover everything from basic angle adjustments to advanced methods like custom camera paths and smooth transitions.
Use view_init to set azimuth and elevation
In 3D plotting, the azimuth angle determines the horizontal rotation, while the elevation angle sets the vertical tilt.
You can use the view_init() method to set specific azimuth and elevation angles:
import numpy as np
import matplotlib.pyplot as plt
from mpl_toolkits.mplot3d import Axes3D
x = np.linspace(-5, 5, 100)
y = np.linspace(-5, 5, 100)
X, Y = np.meshgrid(x, y)
Z = np.sin(np.sqrt(X**2 + Y**2))
fig = plt.figure(figsize=(15, 5))

# Default view
ax1 = fig.add_subplot(131, projection='3d')
ax1.plot_surface(X, Y, Z, cmap='viridis')
ax1.set_title('Default View')

# Change azimuth
ax2 = fig.add_subplot(132, projection='3d')
ax2.plot_surface(X, Y, Z, cmap='viridis')
ax2.view_init(elev=20, azim=45)
ax2.set_title('Azimuth: 45°')

# Change elevation
ax3 = fig.add_subplot(133, projection='3d')
ax3.plot_surface(X, Y, Z, cmap='viridis')
ax3.view_init(elev=60, azim=0)
ax3.set_title('Elevation: 60°')
plt.tight_layout()
plt.show()
Output:
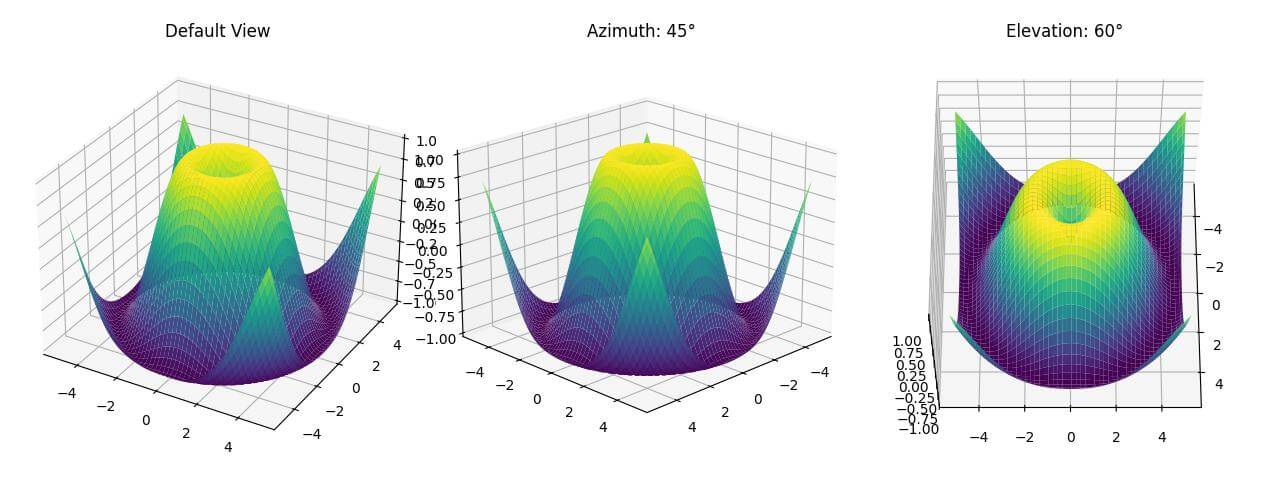
The three subplots show how changing azimuth and elevation affects the view.
The middle plot rotates the view horizontally, while the right plot tilts it vertically.
Create animations with changing camera angles
To create an animation with changing camera angles, you can use a loop to update the view:
import matplotlib.animation as animation
def rotate(angle):
    ax.view_init(elev=10., azim=angle)
    return ax
fig = plt.figure(figsize=(8, 6))
ax = fig.add_subplot(111, projection='3d')
ax.plot_surface(X, Y, Z, cmap='viridis')
anim = animation.FuncAnimation(fig, rotate, frames=np.arange(0, 362, 2), interval=100)
plt.close()  # Prevents displaying the static plot
anim.save('rotation_animation.gif', writer='pillow', fps=30)
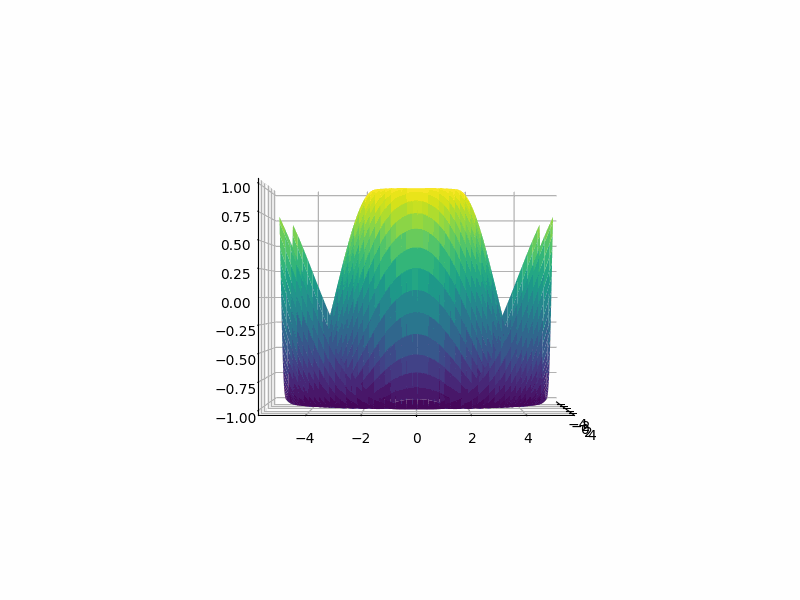
Output:

Using FuncAnimation for smooth transitions
For smoother transitions between camera angles, you can use FuncAnimation with interpolation:
from scipy.interpolate import interp1d
def smooth_transition(frame):
    elev = elev_interp(frame)
    azim = azim_interp(frame)
    ax.view_init(elev=elev, azim=azim)
    return ax
fig = plt.figure(figsize=(8, 6))
ax = fig.add_subplot(111, projection='3d')
ax.plot_surface(X, Y, Z, cmap='viridis')
frames = 100
elev_start, elev_end = 0, 90
azim_start, azim_end = 0, 180
elev_interp = interp1d([0, frames], [elev_start, elev_end])
azim_interp = interp1d([0, frames], [azim_start, azim_end])
anim = animation.FuncAnimation(fig, smooth_transition, frames=frames, interval=50)
plt.close()
anim.save('smooth_transition.gif', writer='pillow', fps=30)
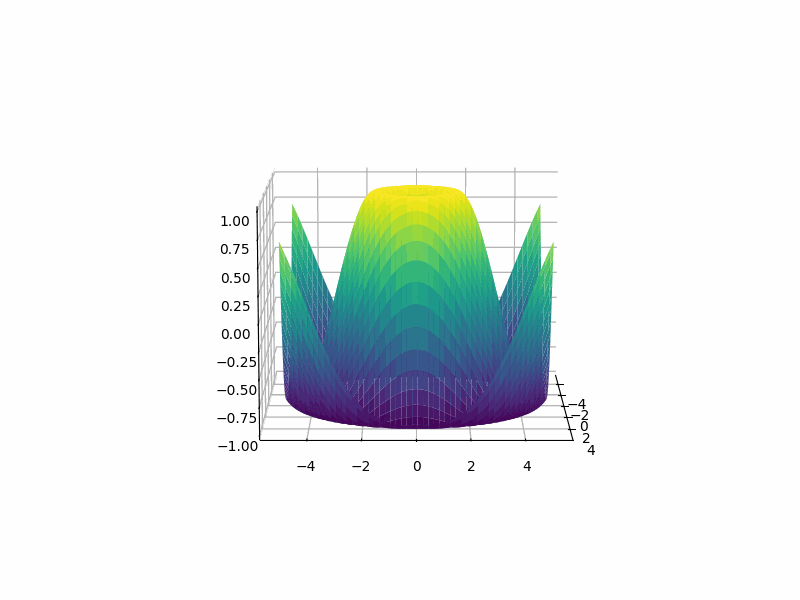
Output:
This animation smoothly transitions from a front view to a top-down view while rotating.
Save Animated plots as GIF or MP4
You can use various writers to save your animated plots in different formats.
Here’s how to save as both GIF and MP4:
import matplotlib.animation as animation
def rotate(angle):
    ax.view_init(elev=10., azim=angle)
    return ax
fig = plt.figure(figsize=(8, 6))
ax = fig.add_subplot(111, projection='3d')
ax.plot_surface(X, Y, Z, cmap='viridis')
anim = animation.FuncAnimation(fig, rotate, frames=np.arange(0, 362, 2), interval=50)

# Save as GIF
anim.save('rotation_animation.gif', writer='pillow', fps=30)

# Save as MP4
Writer = animation.writers['ffmpeg']
writer = Writer(fps=30, metadata=dict(artist='Me'), bitrate=1800)
anim.save('rotation_animation.mp4', writer=writer)
Output:
This code creates two files: a GIF and an MP4 of the rotating 3D plot.
The MP4 version requires FFmpeg to be installed on your system.
Custom Camera Path (Using interpolation)
Let’s create a more complex camera path that combines changes in elevation, azimuth, and zoom:
from scipy.interpolate import interp1d
def custom_camera_path(frame):
    elev = elev_interp(frame)
    azim = azim_interp(frame)
    dist = dist_interp(frame)
    ax.view_init(elev=elev, azim=azim)
    ax.dist = dist
    return ax
fig = plt.figure(figsize=(8, 6))
ax = fig.add_subplot(111, projection='3d')
surf = ax.plot_surface(X, Y, Z, cmap='viridis')
frames = 300
keyframes = [0, 75, 150, 225, 299]
elevations = [0, 45, 90, 45, 0]
azimuths = [0, 90, 180, 270, 359]
distances = [10, 8, 6, 8, 10]  # Controls zoom level
elev_interp = interp1d(keyframes, elevations, kind='cubic')
azim_interp = interp1d(keyframes, azimuths, kind='cubic')
dist_interp = interp1d(keyframes, distances, kind='cubic')
anim = animation.FuncAnimation(fig, custom_camera_path, frames=frames, interval=50)
plt.close()
anim.save('complex_camera_path.gif', writer='pillow', fps=30)
Output:

This animation creates a smooth camera movement that not only changes the elevation and azimuth but also zooms in and out.
Save and restore camera settings
To save and restore camera settings across different plotting sessions, you can use Python pickle module:
import matplotlib.pyplot as plt
import pickle
import os
import numpy as np
from mpl_toolkits.mplot3d import Axes3D
def save_view(ax, filename='view.pkl'):
  """Save the current view (camera position and zoom level)"""
  view = {
      'elev': ax.elev,
      'azim': ax.azim,
      'xlim': ax.get_xlim(),
      'ylim': ax.get_ylim(),
      'zlim': ax.get_zlim()
  }
  with open(filename, 'wb') as f:
      pickle.dump(view, f)
def load_view(ax, filename='view.pkl'):
  """Load the view (camera position and zoom level)"""
  if os.path.exists(filename):
      with open(filename, 'rb') as f:
          view = pickle.load(f)
          ax.view_init(elev=view['elev'], azim=view['azim'])
          ax.set_xlim(view['xlim'])
          ax.set_ylim(view['ylim'])
          ax.set_zlim(view['zlim'])
fig = plt.figure()
ax = fig.add_subplot(111, projection='3d')

# Load the previous view if it exists
load_view(ax)
x = np.linspace(-5, 5, 100)
y = np.linspace(-5, 5, 100)
X, Y = np.meshgrid(x, y)
Z = np.sin(np.sqrt(X**2 + Y**2))
ax.plot_surface(X, Y, Z, cmap='viridis')

# Connect the save function to the figure's close event
fig.canvas.mpl_connect('close_event', lambda event: save_view(ax))
plt.show()
This code shows how to save camera settings to a view.pkl file and load them later.
Mokhtar is the founder of LikeGeeks.com. He is a seasoned technologist and accomplished author, with expertise in Linux system administration and Python development. Since 2010, Mokhtar has built an impressive career, transitioning from system administration to Python development in 2015. His work spans large corporations to freelance clients around the globe. Alongside his technical work, Mokhtar has authored some insightful books in his field. Known for his innovative solutions, meticulous attention to detail, and high-quality work, Mokhtar continually seeks new challenges within the dynamic field of technology.