Plot 3D Cylinder in Python Using Matplotlib
In this tutorial, you’ll learn how to plot 3D cylinders using Python. You’ll use the Matplotlib library to create visualizations of cylinders in three-dimensional space.
We’ll cover various aspects of cylinder plotting, from basic shapes to advanced customizations.
Create a basic 3D cylinder
To start, you’ll need to import the necessary libraries and define the cylinder’s parameters.
import numpy as np
import matplotlib.pyplot as plt
from mpl_toolkits.mplot3d import Axes3D
radius = 1.0
height = 3.0
Next, you’ll generate the surface coordinates of the cylinder using NumPy functions.
theta = np.linspace(0, 2*np.pi, 100)
z = np.linspace(0, height, 100)
theta, z = np.meshgrid(theta, z)
x = radius * np.cos(theta)
y = radius * np.sin(theta)
Now, you can create the 3D plot and visualize the cylinder using the plot_surface function.
fig = plt.figure(figsize=(8, 6))
ax = fig.add_subplot(111, projection='3d')
ax.plot_surface(x, y, z, cmap='viridis')
ax.set_xlabel('X')
ax.set_ylabel('Y')
ax.set_zlabel('Z')
ax.set_title('Basic 3D Cylinder')
plt.show()
Output:
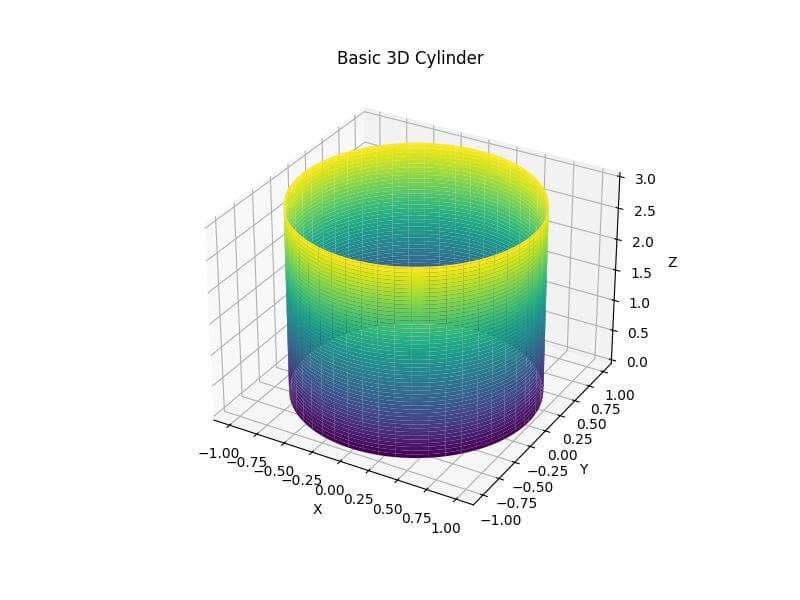
This code generates a 3D plot of a cylinder with a radius of 1.0 and a height of 3.0.
Customize cylinder appearance
You can enhance the cylinder appearance by adding textures and patterns to its surface.
fig = plt.figure(figsize=(8, 6))
ax = fig.add_subplot(111, projection='3d')
ax.plot_surface(x, y, z, cmap='viridis', linewidth=0.5, antialiased=True, rstride=10, cstride=10)
ax.set_xlabel('X')
ax.set_ylabel('Y')
ax.set_zlabel('Z')
ax.set_title('Cylinder with Surface Texture')
plt.show()
Output:
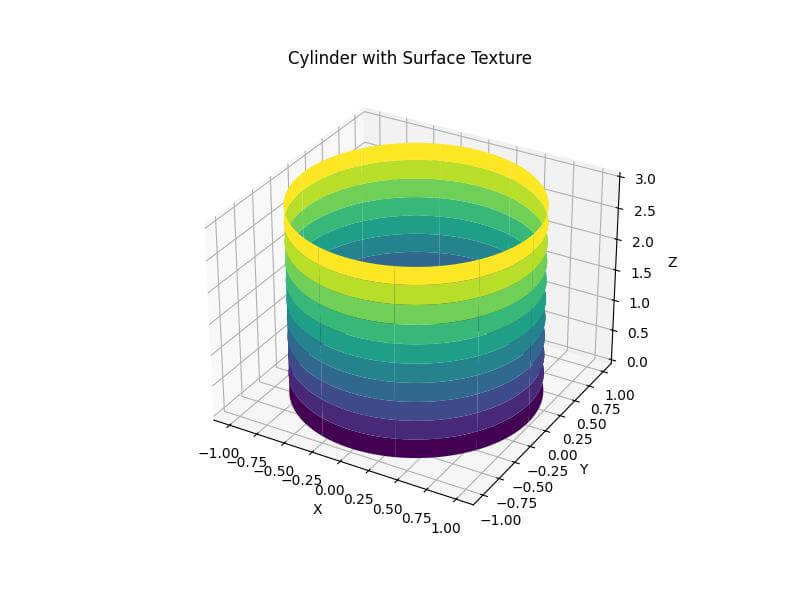
This code adds a grid-like texture to the cylinder’s surface by setting rstride and cstride parameters.
The linewidth and antialiased parameters further enhance the visual appeal.
Apply different color maps
You can try different color maps to change the cylinder appearance.
fig = plt.figure(figsize=(8, 6))
ax = fig.add_subplot(111, projection='3d')
surf = ax.plot_surface(x, y, z, cmap='coolwarm', linewidth=0, antialiased=False)
ax.set_xlabel('X')
ax.set_ylabel('Y')
ax.set_zlabel('Z')
ax.set_title('Cylinder with Custom Colormap')
fig.colorbar(surf, shrink=0.5, aspect=5)
plt.show()
Output:
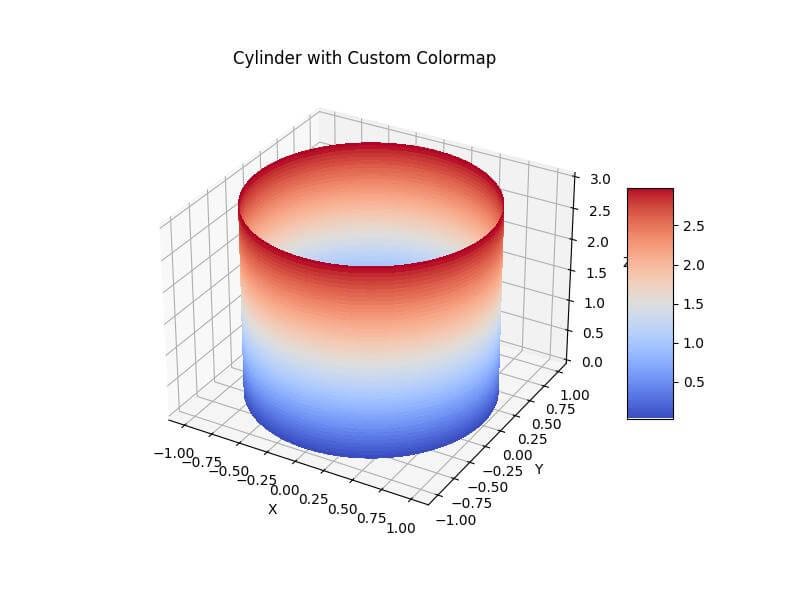
This code applies the ‘coolwarm’ colormap to the cylinder and adds a color bar to show the range of values.
Create Hollow Cylinders
To create a hollow cylinder, you can plot two cylinders with different radii.
outer_radius = 1.0
inner_radius = 0.7
height = 3.0
theta = np.linspace(0, 2*np.pi, 100)
z = np.linspace(0, height, 100)
theta, z = np.meshgrid(theta, z)
x_outer = outer_radius * np.cos(theta)
y_outer = outer_radius * np.sin(theta)
x_inner = inner_radius * np.cos(theta)
y_inner = inner_radius * np.sin(theta)
fig = plt.figure(figsize=(8, 6))
ax = fig.add_subplot(111, projection='3d')
ax.plot_surface(x_outer, y_outer, z, cmap='viridis', alpha=0.7)
ax.plot_surface(x_inner, y_inner, z, cmap='plasma', alpha=0.7)
ax.set_xlabel('X')
ax.set_ylabel('Y')
ax.set_zlabel('Z')
ax.set_title('Hollow Cylinder')
plt.show()
Output:
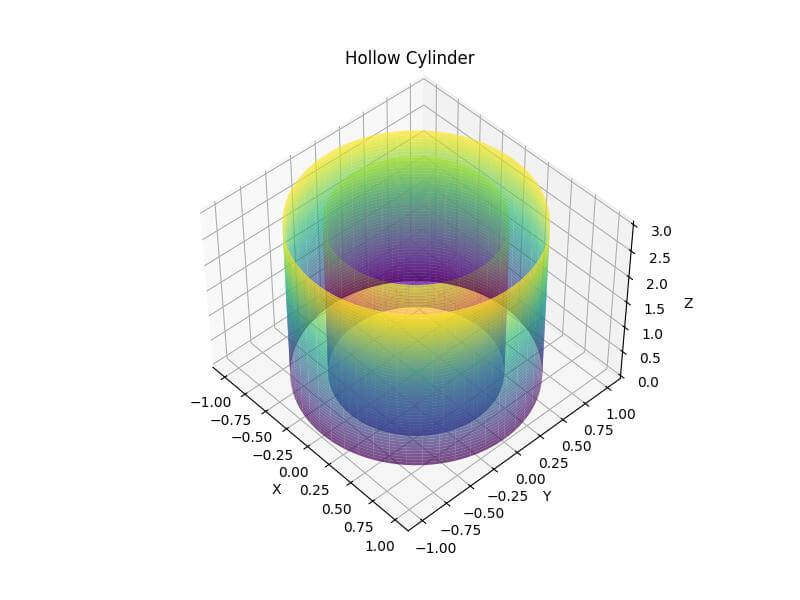
The outer cylinder uses the ‘viridis’ colormap, while the inner cylinder uses the ‘plasma’ colormap.
The alpha parameter is set to 0.7 to make both surfaces slightly transparent.
Implement Tapered or Conical Cylinders
To create a tapered or conical cylinder, you can vary the radius along the height of the cylinder.
base_radius = 1.0
top_radius = 0.5
height = 3.0
theta = np.linspace(0, 2*np.pi, 100)
z = np.linspace(0, height, 100)
theta, z = np.meshgrid(theta, z)
r = base_radius + (top_radius - base_radius) * (z / height)
x = r * np.cos(theta)
y = r * np.sin(theta)
fig = plt.figure(figsize=(8, 6))
ax = fig.add_subplot(111, projection='3d')
ax.plot_surface(x, y, z, cmap='coolwarm')
ax.set_xlabel('X')
ax.set_ylabel('Y')
ax.set_zlabel('Z')
ax.set_title('Tapered Cylinder (Cone)')
plt.show()
Output:
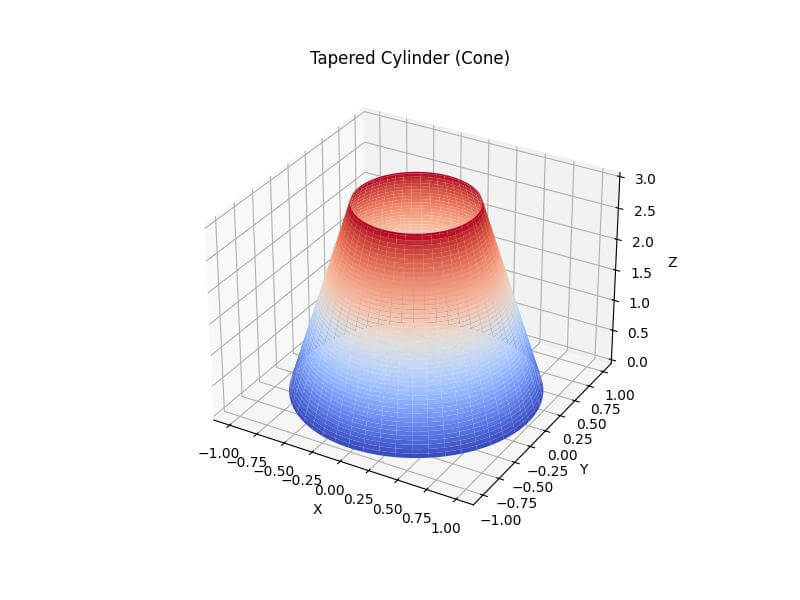
This code generates a tapered cylinder (cone) by linearly interpolating the radius from the base to the top.
The resulting shape has a base radius of 1.0 and a top radius of 0.5, creating a conical appearance.
Generate Multiple Cylinders in One Plot
You can create multiple cylinders in a single plot to compare different shapes or sizes.
def create_cylinder(radius, height, position):
    theta = np.linspace(0, 2*np.pi, 100)
    z = np.linspace(0, height, 100)
    theta, z = np.meshgrid(theta, z)
    x = radius * np.cos(theta) + position[0]
    y = radius * np.sin(theta) + position[1]
    return x, y, z
fig = plt.figure(figsize=(12, 8))
ax = fig.add_subplot(111, projection='3d')
cylinders = [
    (0.5, 2.0, (-2, -2)),
    (0.7, 3.0, (0, 0)),
    (1.0, 1.5, (2, 2))
]
for radius, height, position in cylinders:
    x, y, z = create_cylinder(radius, height, position)
    ax.plot_surface(x, y, z, cmap='viridis', alpha=0.7)
ax.set_xlabel('X')
ax.set_ylabel('Y')
ax.set_zlabel('Z')
ax.set_title('Multiple Cylinders')
plt.show()
Output:
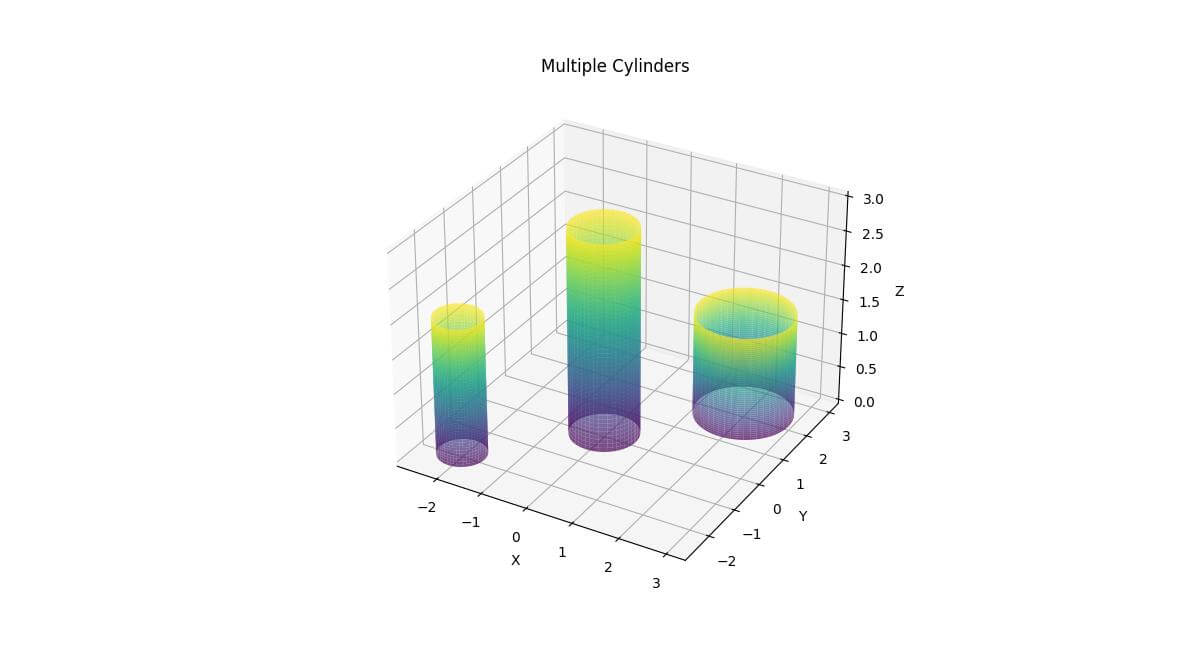
This code defines a function to create cylinders and then plots three cylinders with different radii, heights, and positions in the same 3D space.
Implement Wireframe Representations
You can create a wireframe representation of the cylinder for a different visual effect.
radius = 1.0
height = 3.0
theta = np.linspace(0, 2*np.pi, 20)
z = np.linspace(0, height, 10)
theta, z = np.meshgrid(theta, z)
x = radius * np.cos(theta)
y = radius * np.sin(theta)
fig = plt.figure(figsize=(8, 6))
ax = fig.add_subplot(111, projection='3d')
ax.plot_wireframe(x, y, z, color='blue', linewidth=0.5)
ax.set_xlabel('X')
ax.set_ylabel('Y')
ax.set_zlabel('Z')
ax.set_title('Wireframe Cylinder')
plt.show()
Output:
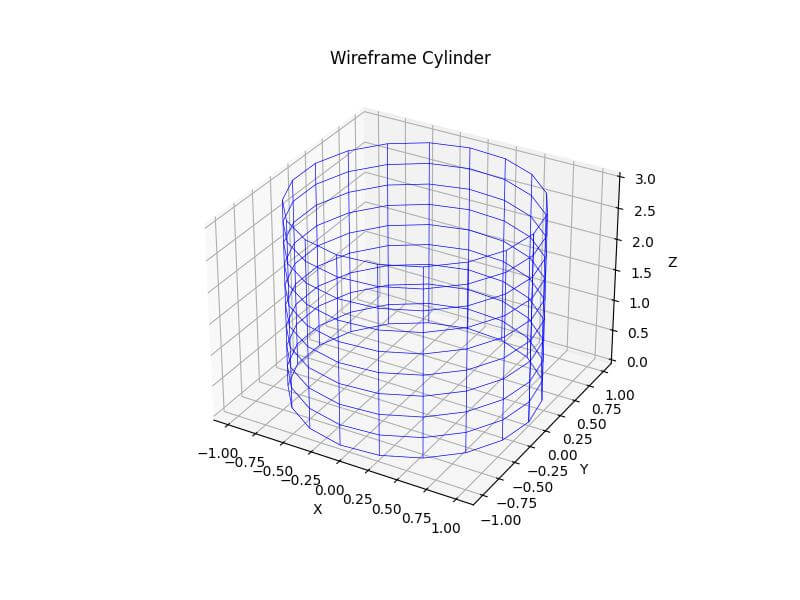
This code creates a wireframe representation of the cylinder using the plot_wireframe function.
Rotate the Cylinder Along Different Axes
You can rotate the cylinder around different axes to change its orientation.
import matplotlib.pyplot as plt
from mpl_toolkits.mplot3d import Axes3D
import numpy as np
def rotate_points(points, axis, angle):
    axis = np.asarray(axis)
    axis = axis / np.linalg.norm(axis)
    a = np.cos(angle / 2.0)
    b, c, d = -axis * np.sin(angle / 2.0)
    aa, bb, cc, dd = a * a, b * b, c * c, d * d
    bc, ad, ac, ab, bd, cd = b * c, a * d, a * c, a * b, b * d, c * d
    rotation_matrix = np.array([
        [aa + bb - cc - dd, 2 * (bc + ad), 2 * (bd - ac)],
        [2 * (bc - ad), aa + cc - bb - dd, 2 * (cd + ab)],
        [2 * (bd + ac), 2 * (cd - ab), aa + dd - bb - cc]
    ])
    return np.dot(points, rotation_matrix.T)

radius = 1.0
height = 3.0
theta = np.linspace(0, 2*np.pi, 100)
z = np.linspace(0, height, 100)
theta, z = np.meshgrid(theta, z)
x = radius * np.cos(theta)
y = radius * np.sin(theta)
points = np.column_stack((x.flatten(), y.flatten(), z.flatten()))
rotated_points = rotate_points(points, [1, 1, 0], np.pi/4)
x_rotated, y_rotated, z_rotated = rotated_points.T
x_rotated = x_rotated.reshape(x.shape)
y_rotated = y_rotated.reshape(y.shape)
z_rotated = z_rotated.reshape(z.shape)
fig = plt.figure(figsize=(8, 6))
ax = fig.add_subplot(111, projection='3d')
ax.plot_surface(x_rotated, y_rotated, z_rotated, cmap='viridis')
ax.set_xlabel('X')
ax.set_ylabel('Y')
ax.set_zlabel('Z')
ax.set_title('Rotated Cylinder')
plt.show()
Output:
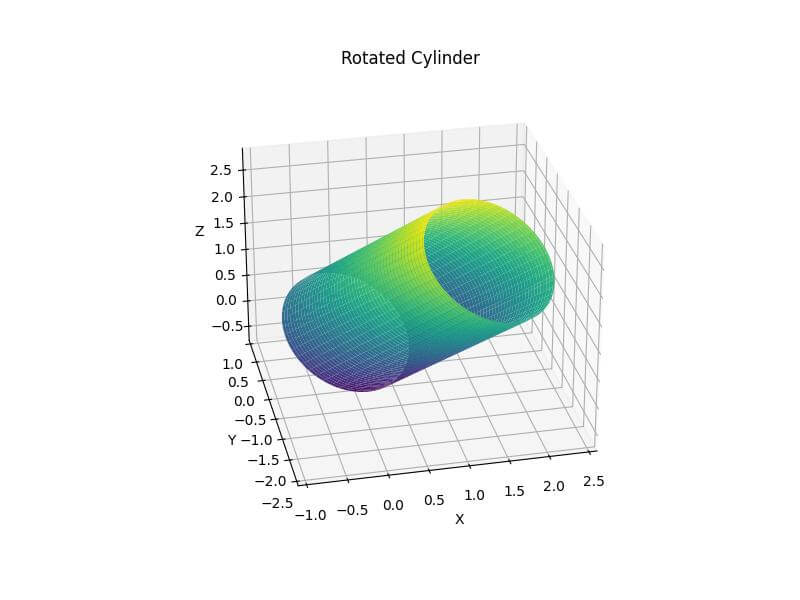
This code defines a rotation function and applies it to the cylinder’s coordinates.
The cylinder is rotated 45 degrees (π/4 radians) around the axis [1, 1, 0].
Mokhtar is the founder of LikeGeeks.com. He is a seasoned technologist and accomplished author, with expertise in Linux system administration and Python development. Since 2010, Mokhtar has built an impressive career, transitioning from system administration to Python development in 2015. His work spans large corporations to freelance clients around the globe. Alongside his technical work, Mokhtar has authored some insightful books in his field. Known for his innovative solutions, meticulous attention to detail, and high-quality work, Mokhtar continually seeks new challenges within the dynamic field of technology.