How to Draw a Triangle in Python 3D PLot
In this tutorial, you’ll learn various methods to plot 3D triangles in Python.
We’ll explore different libraries to create 3D triangle plots.
Using plot_trisurf
The plot_trisurf method from Matplotlib is a straightforward way to create triangle 3D plots.
To create a 3D triangle plot using plot_trisurf, you can use the following code:
import numpy as np
import matplotlib.pyplot as plt
vertices = np.array([[0, 0, 0], [1, 0, 0], [0.5, np.sqrt(3)/2, 0]])
fig = plt.figure()
ax = fig.add_subplot(111, projection='3d')
ax.plot_trisurf(vertices[:, 0], vertices[:, 1], vertices[:, 2])
ax.set_xlabel('X')
ax.set_ylabel('Y')
ax.set_zlabel('Z')
ax.set_title('3D Triangle using plot_trisurf')
plt.show()
Output:
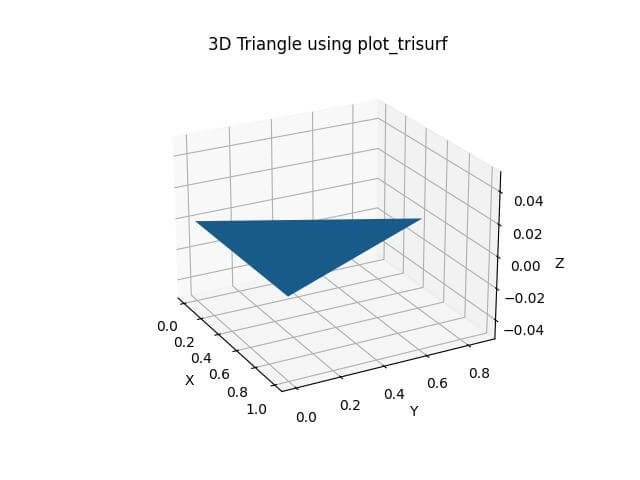
The triangle is defined by three vertices in the XY plane, with Z values set to 0.
Using the plot_surface with a meshgrid
You can use the plot_surface method to create a triangle in a 3D plot with a meshgrid for more control over the surface appearance.
Here’s how you can create a 3D triangle plot using plot_surface:
import numpy as np
import matplotlib.pyplot as plt
vertices = np.array([[0, 0, 0], [1, 0, 1], [0.5, np.sqrt(3)/2, 0.5]])
x = np.linspace(0, 1, 100)
y = np.linspace(0, np.sqrt(3)/2, 100)
X, Y = np.meshgrid(x, y)

# Define the plane equation
Z = 1 - X - Y/np.sqrt(3)
mask = (Y <= np.sqrt(3) * X) & (Y <= np.sqrt(3) * (1 - X))
Z[~mask] = np.nan
fig = plt.figure()
ax = fig.add_subplot(111, projection='3d')
surf = ax.plot_surface(X, Y, Z, cmap='viridis')
ax.set_xlabel('X')
ax.set_ylabel('Y')
ax.set_zlabel('Z')
ax.set_title('3D Triangle using plot_surface')
fig.colorbar(surf)
plt.show()
Output:
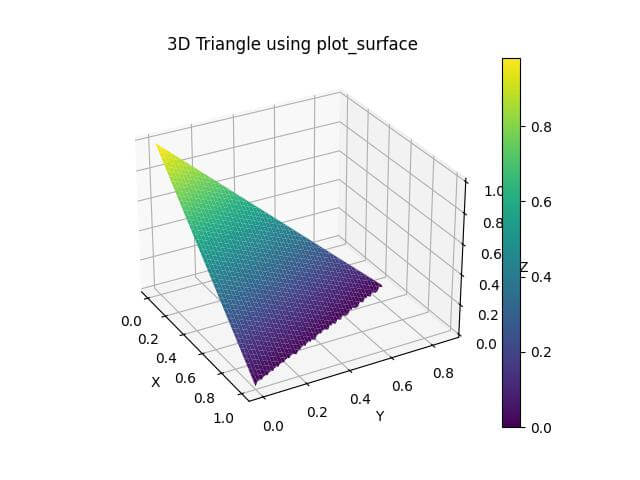
This code defines the triangle vertices, creates a meshgrid, and applies a mask to show only the triangle area.
Using Poly3DCollection
To create a triangle 3D plot using Poly3DCollection, you can use this code:
import numpy as np
import matplotlib.pyplot as plt
from mpl_toolkits.mplot3d.art3d import Poly3DCollection
vertices = np.array([[0, 0, 0], [1, 0, 1], [0.5, np.sqrt(3)/2, 0.5]])
fig = plt.figure()
ax = fig.add_subplot(111, projection='3d')

# Create a Poly3DCollection
triangle = Poly3DCollection([vertices], alpha=0.8, edgecolor='k')
triangle.set_facecolor('cyan')
ax.add_collection3d(triangle)
ax.set_xlim(0, 1)
ax.set_ylim(0, 1)
ax.set_zlim(0, 1)
ax.set_xlabel('X')
ax.set_ylabel('Y')
ax.set_zlabel('Z')
ax.set_title('3D Triangle using Poly3DCollection')
plt.show()
Output:
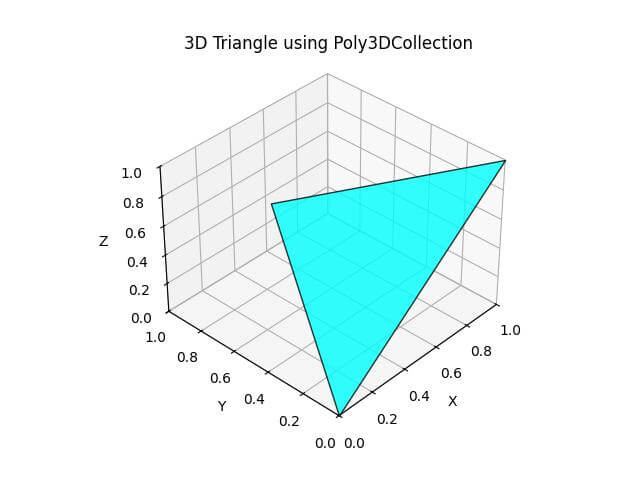
This code defines the triangle vertices and creates a collection with custom face color and edge color.
Using Plotly
Here’s how you can create an interactive triangle in 3D plot using Plotly:
import plotly.graph_objects as go
import numpy as np
vertices = np.array([[0, 0, 0], [1, 0, 1], [0.5, np.sqrt(3)/2, 0.5]])
x, y, z = vertices.T
i = [0, 0]
j = [1, 2]
k = [2, 1]

# Create the triangle plot
fig = go.Figure(data=[
    go.Mesh3d(x=x, y=y, z=z, i=i, j=j, k=k, color='cyan', opacity=0.8)
])

# Set layout options
fig.update_layout(
    scene=dict(
        xaxis_title='X',
        yaxis_title='Y',
        zaxis_title='Z'
    ),
    title='Interactive 3D Triangle using Plotly'
)
fig.show()
Output:
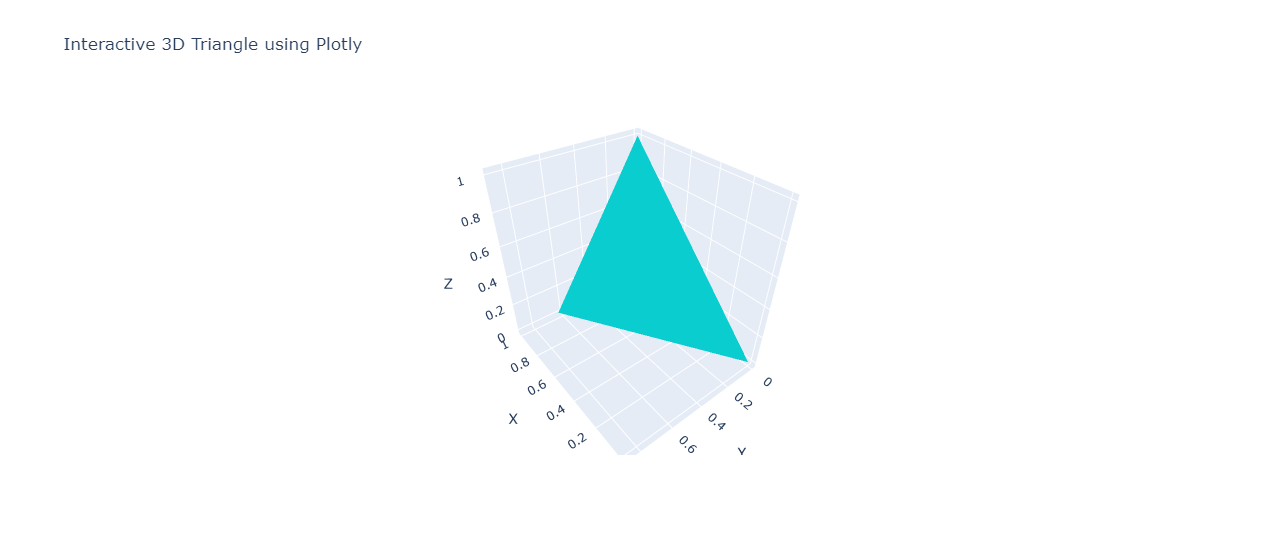
This code defines the triangle vertices and creates a mesh using the Mesh3d object.
Using VTK
To create a triangle in 3D plot using VTK, you can use the following code:
import vtk
import numpy as np
points = vtk.vtkPoints()
points.InsertNextPoint(0, 0, 0)
points.InsertNextPoint(1, 0, 1)
points.InsertNextPoint(0.5, np.sqrt(3)/2, 0.5)
triangle = vtk.vtkTriangle()
triangle.GetPointIds().SetId(0, 0)
triangle.GetPointIds().SetId(1, 1)
triangle.GetPointIds().SetId(2, 2)
triangles = vtk.vtkCellArray()
triangles.InsertNextCell(triangle)

# Create a polydata object
trianglePolyData = vtk.vtkPolyData()
trianglePolyData.SetPoints(points)
trianglePolyData.SetPolys(triangles)

# Create mapper and actor
mapper = vtk.vtkPolyDataMapper()
mapper.SetInputData(trianglePolyData)

actor = vtk.vtkActor()
actor.SetMapper(mapper)
actor.GetProperty().SetColor(0, 1, 1)

# Create a renderer, render window, and interactor
renderer = vtk.vtkRenderer()
renderWindow = vtk.vtkRenderWindow()
renderWindow.AddRenderer(renderer)
renderWindowInteractor = vtk.vtkRenderWindowInteractor()
renderWindowInteractor.SetRenderWindow(renderWindow)
renderer.AddActor(actor)
renderer.SetBackground(0.1, 0.1, 0.1)  # Dark gray background
renderWindow.Render()
renderWindowInteractor.Start()
Output:

This code defines the triangle vertices, creates a polydata object, and sets up the rendering pipeline.
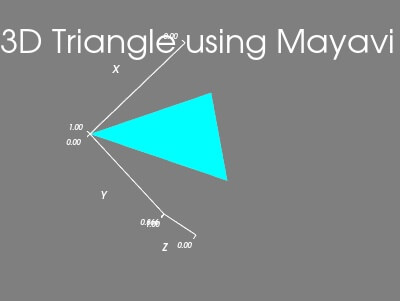
Using Mayavi
You can use the triangular_mesh function to create a triangle in 3D plot using Mayavi:
from mayavi import mlab
import numpy as np
vertices = np.array([[0, 0, 0], [1, 0, 1], [0.5, np.sqrt(3)/2, 0.5]])

# Create the triangle plot
mlab.triangular_mesh([vert[0] for vert in vertices],
                     [vert[1] for vert in vertices],
                     [vert[2] for vert in vertices],
                     [(0, 1, 2)],
                     color=(0, 1, 1))  # Cyan color

mlab.view(azimuth=45, elevation=30, distance=4)
mlab.xlabel('X')
mlab.ylabel('Y')
mlab.zlabel('Z')
mlab.title('3D Triangle using Mayavi')
mlab.show()
Output:
Mokhtar is the founder of LikeGeeks.com. He is a seasoned technologist and accomplished author, with expertise in Linux system administration and Python development. Since 2010, Mokhtar has built an impressive career, transitioning from system administration to Python development in 2015. His work spans large corporations to freelance clients around the globe. Alongside his technical work, Mokhtar has authored some insightful books in his field. Known for his innovative solutions, meticulous attention to detail, and high-quality work, Mokhtar continually seeks new challenges within the dynamic field of technology.