Plot Sigmoid Function in 3D Using Python
In this tutorial, you’ll learn how to plot the sigmoid function in 3D using various Python libraries.
The sigmoid function is a popular activation function in machine learning and neural networks.
Visualizing it in 3D provides valuable insights into its behavior across different input ranges.
Using Matplotlib
You can use it to create a 3D plot of the sigmoid function.
To create the 3D mesh plot, you can use the plot_surface function from Matplotlib:
import numpy as np
import matplotlib.pyplot as plt
from mpl_toolkits.mplot3d import Axes3D
def sigmoid(x):
    return 1 / (1 + np.exp(-x))
x = np.linspace(-6, 6, 30)
y = np.linspace(-6, 6, 30)
X, Y = np.meshgrid(x, y)
Z = sigmoid(X + Y)
fig = plt.figure(figsize=(10, 8))
ax = fig.add_subplot(111, projection='3d')
surf = ax.plot_surface(X, Y, Z, cmap='viridis')
ax.set_xlabel('X')
ax.set_ylabel('Y')
ax.set_zlabel('Z')
ax.set_title('3D Sigmoid Function')
fig.colorbar(surf)
plt.show()
Output:
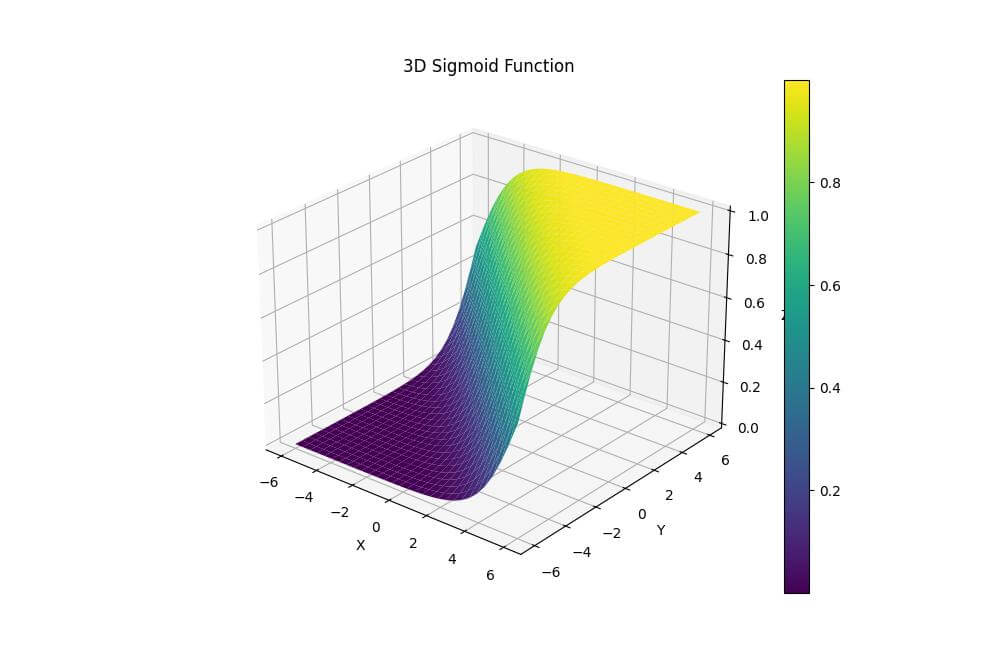
The X and Y axes represent the input values, while the Z-axis shows the output of the sigmoid function.
The colorbar on the right indicates the range of values in the plot.
Using Plotly
You can create an engaging visualization of the sigmoid function using Plotly:
import numpy as np
import plotly.graph_objects as go
def sigmoid(x):
    return 1 / (1 + np.exp(-x))
x = np.linspace(-6, 6, 50)
y = np.linspace(-6, 6, 50)
X, Y = np.meshgrid(x, y)
Z = sigmoid(X + Y)
fig = go.Figure(data=[go.Surface(z=Z, x=X, y=Y)])
fig.update_layout(title='3D Sigmoid Function', autosize=False,
                  width=800, height=600,
                  scene=dict(xaxis_title='X', yaxis_title='Y', zaxis_title='Z'))
fig.show()
Output:
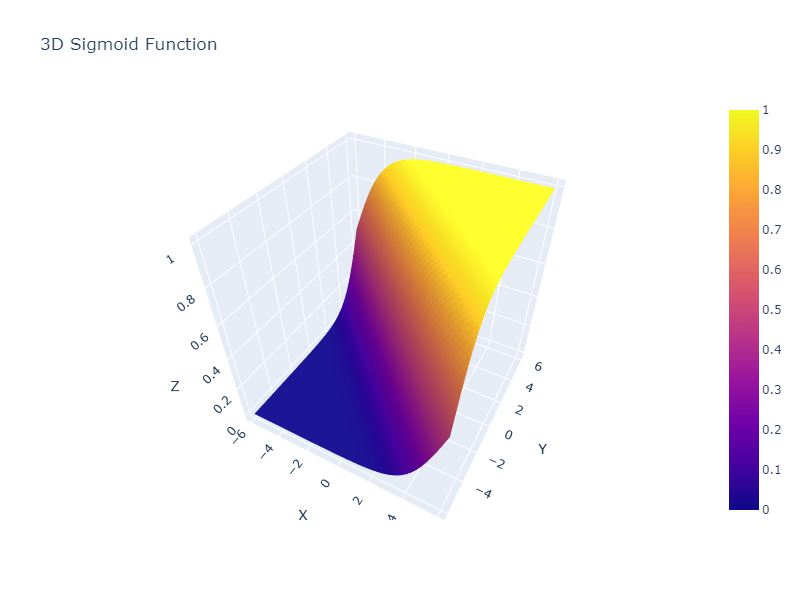
You can rotate, zoom, and pan the plot to explore different aspects of the sigmoid function.
The color gradient represents the range of values in the Z-axis.
Wireframe Plot Representation
You can combine numpy and mpl_toolkits to create a 3D wireframe plot of the sigmoid function:
import numpy as np
import matplotlib.pyplot as plt
from mpl_toolkits.mplot3d import Axes3D
def sigmoid(x):
    return 1 / (1 + np.exp(-x))
x = np.linspace(-6, 6, 30)
y = np.linspace(-6, 6, 30)
X, Y = np.meshgrid(x, y)
Z = sigmoid(X + Y)
fig = plt.figure(figsize=(10, 8))
ax = fig.add_subplot(111, projection='3d')
ax.plot_wireframe(X, Y, Z, rstride=2, cstride=2)
ax.set_xlabel('X')
ax.set_ylabel('Y')
ax.set_zlabel('Z')
ax.set_title('3D Sigmoid Function (Wireframe)')
plt.show()
Output:
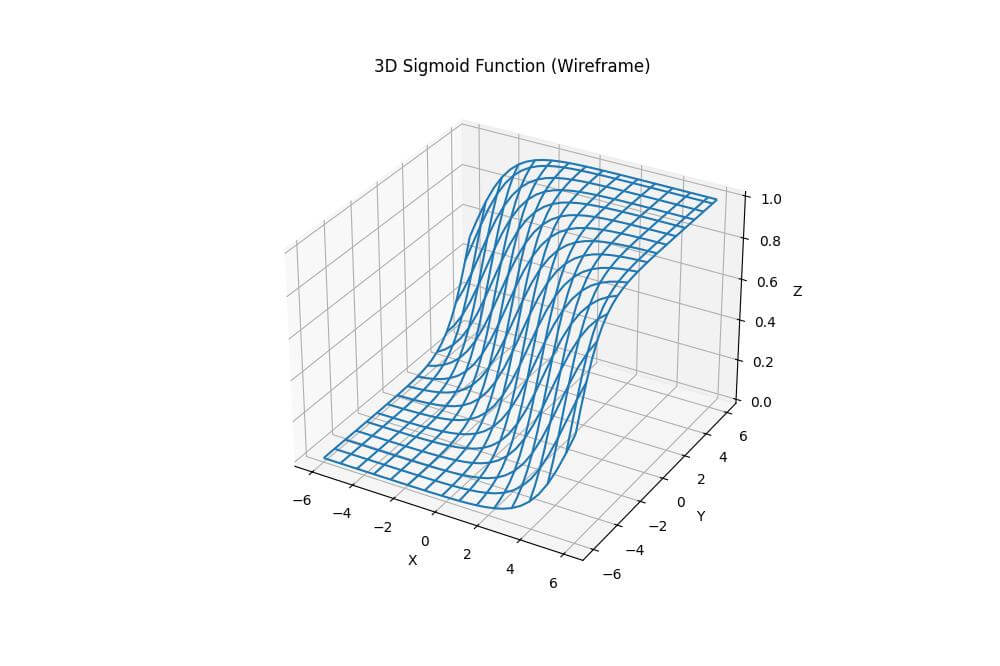
The wireframe representation allows you to see through the surface.
The rstride and cstride parameters control the density of the wireframe.
Mokhtar is the founder of LikeGeeks.com. He is a seasoned technologist and accomplished author, with expertise in Linux system administration and Python development. Since 2010, Mokhtar has built an impressive career, transitioning from system administration to Python development in 2015. His work spans large corporations to freelance clients around the globe. Alongside his technical work, Mokhtar has authored some insightful books in his field. Known for his innovative solutions, meticulous attention to detail, and high-quality work, Mokhtar continually seeks new challenges within the dynamic field of technology.