How to Plot 3d Cube in Python
In this tutorial, you’ll learn how to plot a 3D cube in Python.
We’ll explore libraries such as Mayavi, Panda3D, Plotly, VPython, Vispy, and ipyvolume.
Using Mayavi
You can create a 3D cube using the mlab.points3d() function:
from mayavi import mlab
import numpy as np

# Create cube vertices
x, y, z = np.mgrid[0:1, 0:1, 0:1]
cube = np.vstack((x.flatten(), y.flatten(), z.flatten())).T
mlab.points3d(cube[:, 0], cube[:, 1], cube[:, 2], mode='cube', color=(0.2, 0.8, 0.5), scale_factor=1.0)
mlab.show()
Output:
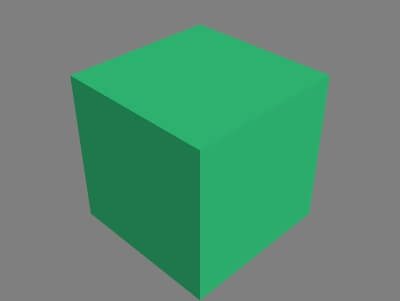
The code creates a cube using Mayavi points3d() function, with each point represented as a smaller cube.
Using Panda3D
Panda3D is a game engine and framework for 3D rendering. You can use it to create a 3D cube:
from direct.showbase.ShowBase import ShowBase
from panda3d.core import GeomVertexFormat, GeomVertexData, Geom, GeomTriangles, GeomVertexWriter, GeomNode
class CubeDemo(ShowBase):
    def __init__(self):
        ShowBase.__init__(self)
        format = GeomVertexFormat.getV3n3c4()
        vdata = GeomVertexData('cube', format, Geom.UHStatic)
        vertex = GeomVertexWriter(vdata, 'vertex')
        color = GeomVertexWriter(vdata, 'color')

        # Define cube vertices and colors
        vertices = [
            (-1, -1, -1), (1, -1, -1), (-1, 1, -1), (1, 1, -1),
            (-1, -1, 1), (1, -1, 1), (-1, 1, 1), (1, 1, 1)
        ]
        colors = [
            (1, 0, 0, 1), (0, 1, 0, 1), (0, 0, 1, 1), (1, 1, 0, 1),
            (1, 0, 1, 1), (0, 1, 1, 1), (0.5, 0.5, 0.5, 1), (1, 1, 1, 1)
        ]
        for v, c in zip(vertices, colors):
            vertex.addData3f(*v)
            color.addData4f(*c)

        prim = GeomTriangles(Geom.UHStatic)

        # Define cube faces
        indices = [
            0, 1, 2, 3, 2, 1,  # Front
            4, 5, 6, 7, 6, 5,  # Back
            0, 4, 1, 5, 1, 4,  # Left
            2, 3, 6, 7, 6, 3,  # Right
            0, 2, 4, 6, 4, 2,  # Bottom
            1, 5, 3, 7, 3, 5   # Top
        ]
        for i in indices:
            prim.addVertex(i)
        geom = Geom(vdata)
        geom.addPrimitive(prim)
        node = GeomNode('cube')
        node.addGeom(geom)
        cube = self.render.attachNewNode(node)
        cube.setPos(0, 5, 0)
        self.cam.setPos(0, -10, 0)
demo = CubeDemo()
demo.run()
Output:
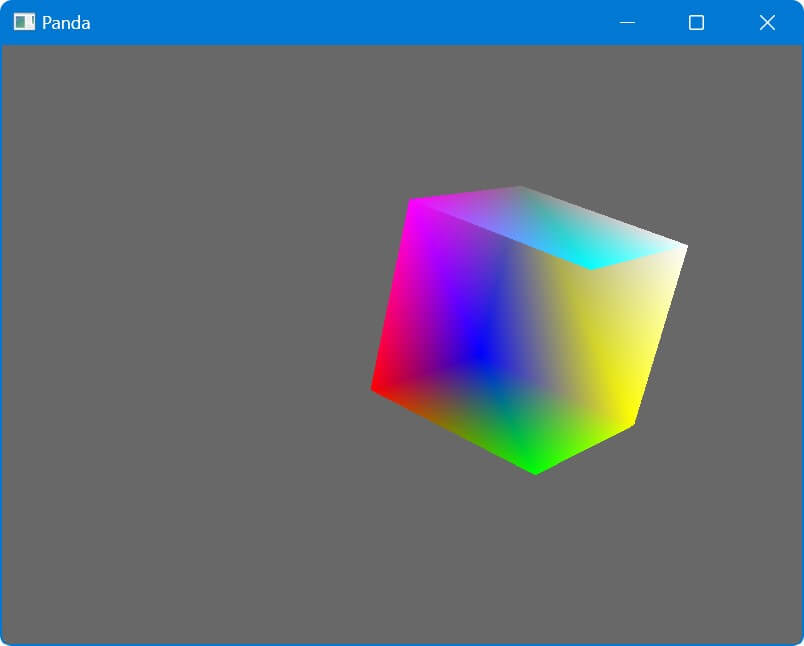
Each vertex of the cube is assigned a different color.
Using Plotly
You can create a 3D cube using the go.Mesh3d() function:
import plotly.graph_objects as go

# Define the vertices of the cube
vertices = [
    [0, 0, 0],
    [1, 0, 0],
    [1, 1, 0],
    [0, 1, 0],
    [0, 0, 1],
    [1, 0, 1],
    [1, 1, 1],
    [0, 1, 1]
]

# Define the edges of the cube
edges = [
    [vertices[0], vertices[1]],
    [vertices[1], vertices[2]],
    [vertices[2], vertices[3]],
    [vertices[3], vertices[0]],
    [vertices[4], vertices[5]],
    [vertices[5], vertices[6]],
    [vertices[6], vertices[7]],
    [vertices[7], vertices[4]],
    [vertices[0], vertices[4]],
    [vertices[1], vertices[5]],
    [vertices[2], vertices[6]],
    [vertices[3], vertices[7]]
]

# Create the 3D plot
fig = go.Figure()

# Add edges to the plot
for edge in edges:
    fig.add_trace(go.Scatter3d(
        x=[edge[0][0], edge[1][0]],
        y=[edge[0][1], edge[1][1]],
        z=[edge[0][2], edge[1][2]],
        mode='lines',
        line=dict(color='blue', width=4)
    ))

fig.update_layout(
    scene=dict(
        xaxis_title='X',
        yaxis_title='Y',
        zaxis_title='Z'
    ),
    title='3D Cube Plot'
)
fig.show()
Output:
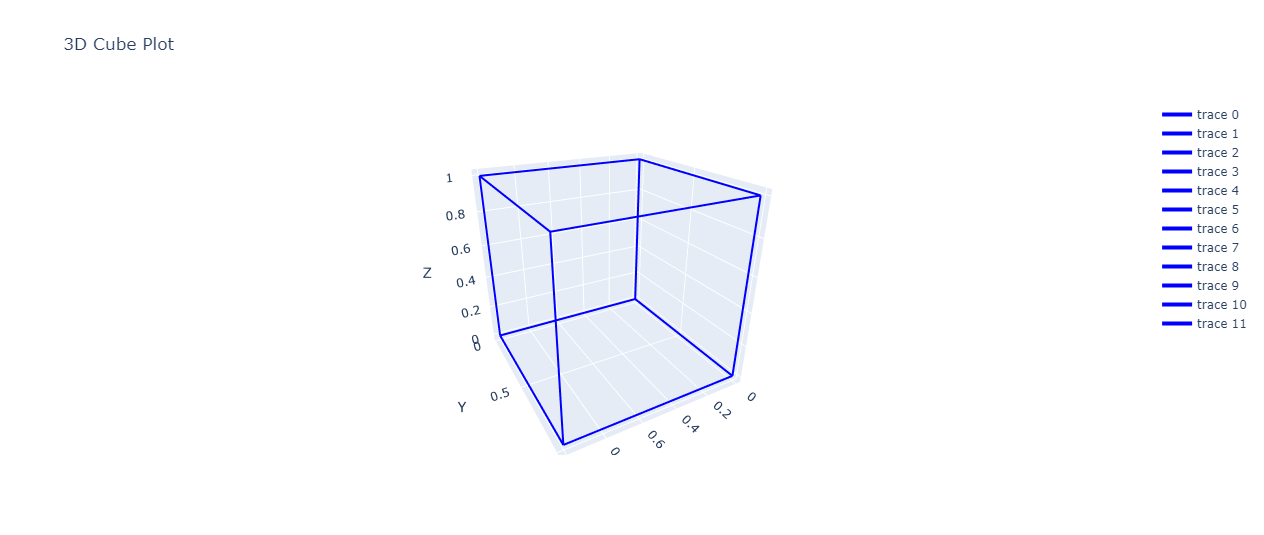
The cube is can be rotated and zoomed using the mouse or touchpad.
Using VPython
VPython allows for easy creation of 3D objects. You can create a cube using the box() function:
from vpython import *

# Create a canvas
canvas(width=800, height=600, center=vector(0,0,0), background=color.white)

# Create a cube
cube = box(pos=vector(0,0,0), size=vector(2,2,2), color=color.red)

# Add lighting
local_light(pos=vector(5,5,5))

# Keep the window open
while True:
    rate(30)
    cube.rotate(angle=0.01, axis=vector(1,1,0))
Output:
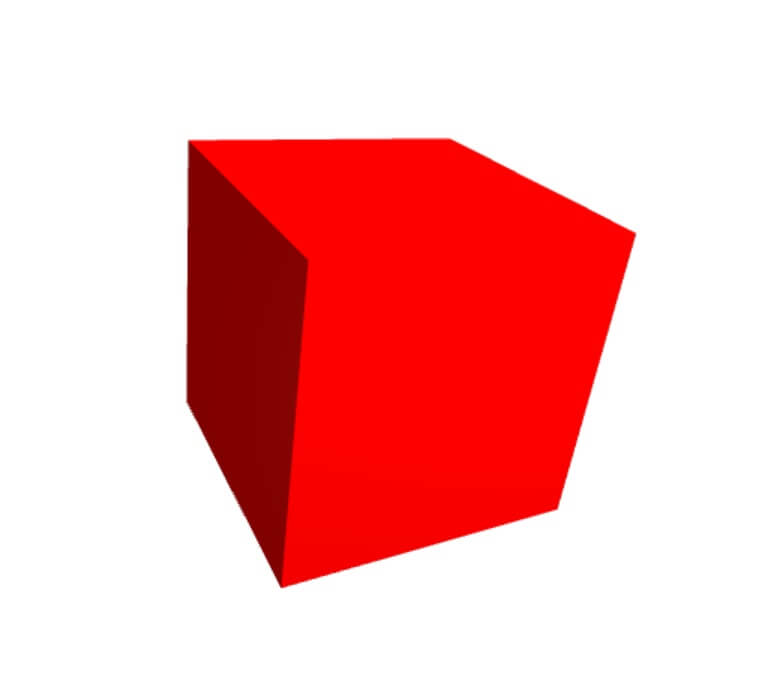
This code creates a 3D scene with a red cube that continuously rotates.
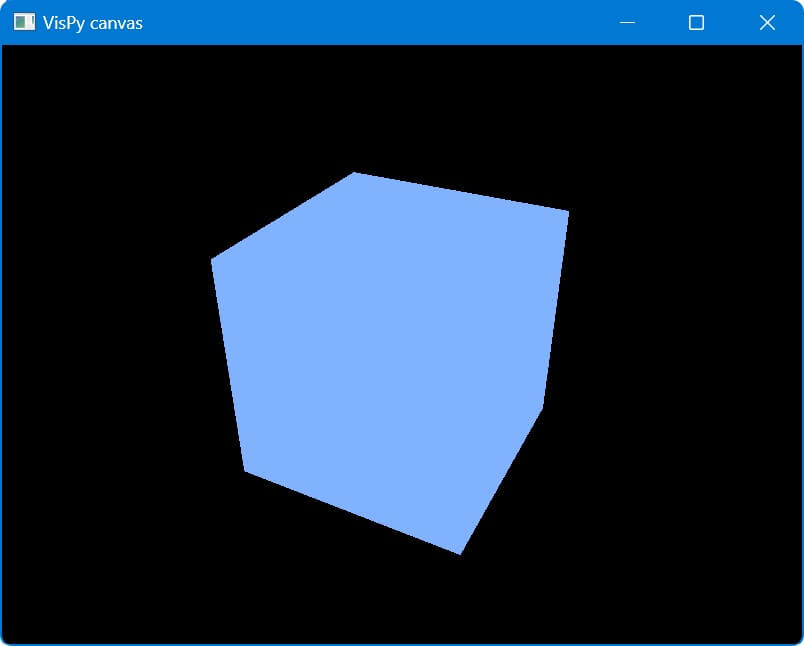
Using Vispy
You can create a 3D cube using Vispy scene API:
from vispy import app, scene
import numpy as np

# Create a canvas
canvas = scene.SceneCanvas(keys='interactive', size=(800, 600), show=True)

# Create a view box
view = canvas.central_widget.add_view()
view.camera = 'turntable'
view.camera.fov = 45
view.camera.distance = 6

# Create cube vertices
vertices = np.array([
    [1, 1, 1], [-1, 1, 1], [-1, -1, 1], [1, -1, 1],
    [1, 1, -1], [-1, 1, -1], [-1, -1, -1], [1, -1, -1],
])

# Define cube faces
faces = np.array([
    [0, 1, 2], [0, 2, 3], [0, 4, 7], [0, 7, 3],
    [0, 1, 5], [0, 5, 4], [1, 2, 6], [1, 6, 5],
    [2, 3, 7], [2, 7, 6], [4, 5, 6], [4, 6, 7]
])

# Create a mesh from the vertices and faces
mesh = scene.visuals.Mesh(vertices=vertices, faces=faces, color=(0.5, 0.7, 1, 1))
view.add(mesh)
app.run()
Output:
Using ipyvolume (Jupyter Notebook)
Ipyvolume is a Python library for 3D plotting in Jupyter notebooks. You can create a 3D cube using the plot_trisurf() function:
import ipyvolume as ipv
import numpy as np
fig = ipv.figure()

# Define cube vertices
x = np.array([0, 0, 1, 1, 0, 0, 1, 1])
y = np.array([0, 1, 1, 0, 0, 1, 1, 0])
z = np.array([0, 0, 0, 0, 1, 1, 1, 1])

# Define cube faces
triangles = np.array([
    [0, 1, 2], [0, 2, 3],  # front
    [4, 5, 6], [4, 6, 7],  # back
    [0, 4, 7], [0, 7, 3],  # right
    [1, 5, 6], [1, 6, 2],  # left
    [3, 2, 6], [3, 6, 7],  # top
    [0, 1, 5], [0, 5, 4]   # bottom
])
ipv.plot_trisurf(x, y, z, triangles=triangles, color='cyan')
ipv.show()
Output:
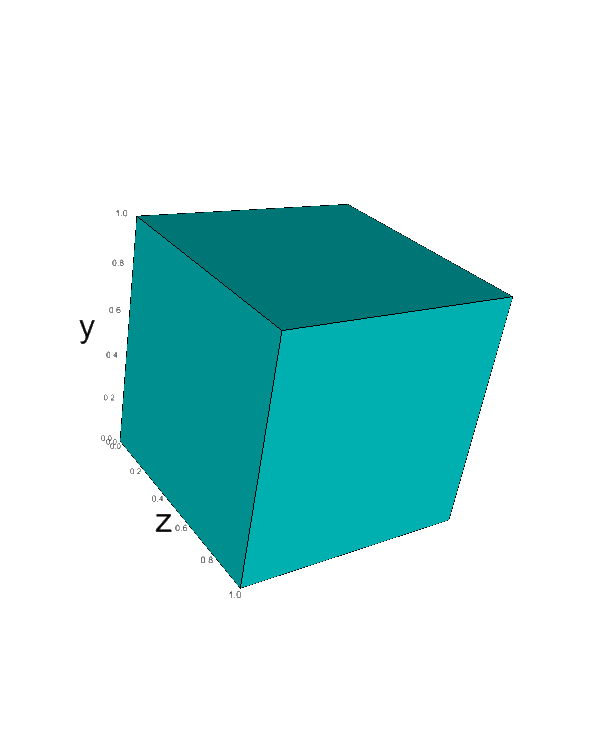
The cube is displayed directly in the Jupyter Notebook and can be rotated and zoomed using the mouse or touchpad.
Mokhtar is the founder of LikeGeeks.com. He is a seasoned technologist and accomplished author, with expertise in Linux system administration and Python development. Since 2010, Mokhtar has built an impressive career, transitioning from system administration to Python development in 2015. His work spans large corporations to freelance clients around the globe. Alongside his technical work, Mokhtar has authored some insightful books in his field. Known for his innovative solutions, meticulous attention to detail, and high-quality work, Mokhtar continually seeks new challenges within the dynamic field of technology.