Customize Marker Size in Python 3D Scatter Plots
In this tutorial, you’ll learn how to customize marker sizes in Python 3D scatter plots.
You’ll explore various methods to control, scale, and dynamically adjust marker sizes.
Control marker size
Using the s parameter
To set the marker size in a 3D scatter plot, you can use the ‘s’ parameter:
import numpy as np
import matplotlib.pyplot as plt
np.random.seed(42)
x = np.random.rand(50)
y = np.random.rand(50)
z = np.random.rand(50)
fig = plt.figure(figsize=(10, 8))
ax = fig.add_subplot(111, projection='3d')
ax.scatter(x, y, z, s=100)  # Set marker size to 100
plt.show()
Output:
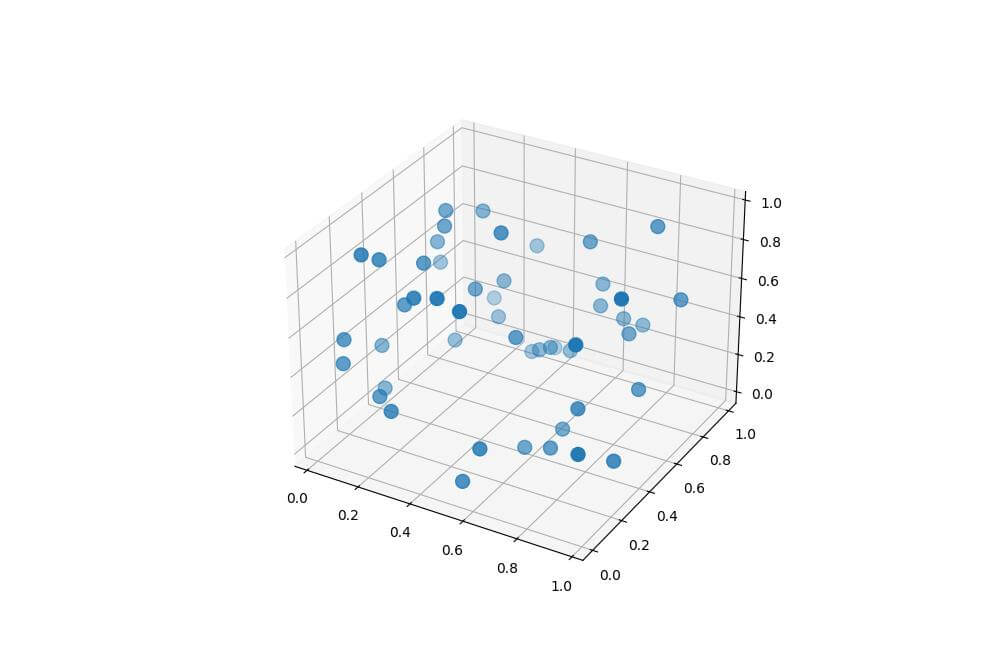
This code creates a 3D scatter plot with markers of size 100. The ‘s’ parameter controls the marker size in points squared.
Varying Marker Sizes Based on Data Values
You can vary marker sizes based on data values:
import numpy as np
import matplotlib.pyplot as plt
np.random.seed(42)
x = np.random.rand(50)
y = np.random.rand(50)
z = np.random.rand(50)
sizes = 1000 * z  # Vary size based on z-values
fig = plt.figure(figsize=(10, 8))
ax = fig.add_subplot(111, projection='3d')
scatter = ax.scatter(x, y, z, s=sizes)
plt.title("3D Scatter Plot with Varying Marker Sizes")
plt.show()
Output:
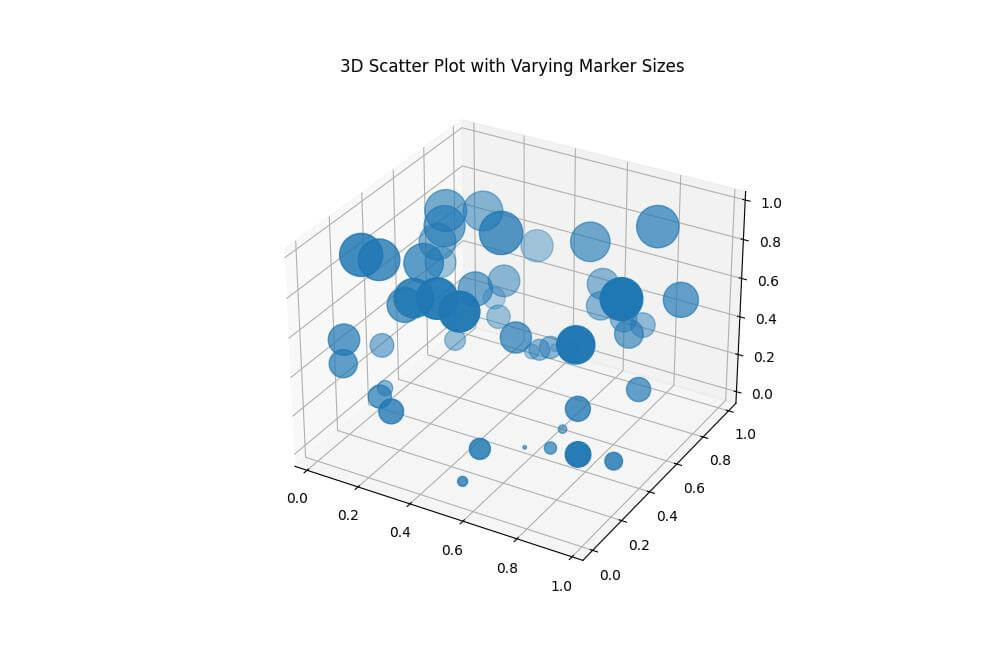
This code varies marker sizes based on z-values, with larger z-values resulting in larger markers.
Scaling Marker Sizes
Linear Scaling
You can apply linear scaling to marker sizes:
import numpy as np
import matplotlib.pyplot as plt
np.random.seed(42)
x = np.random.rand(50)
y = np.random.rand(50)
z = np.random.rand(50)

# Linear scaling of marker sizes
min_size = 20
max_size = 200
sizes = min_size + (max_size - min_size) * z
fig = plt.figure(figsize=(10, 8))
ax = fig.add_subplot(111, projection='3d')
scatter = ax.scatter(x, y, z, s=sizes)
plt.title("3D Scatter Plot with Linearly Scaled Marker Sizes")
plt.colorbar(scatter, label="Z-value")
plt.show()
Output:
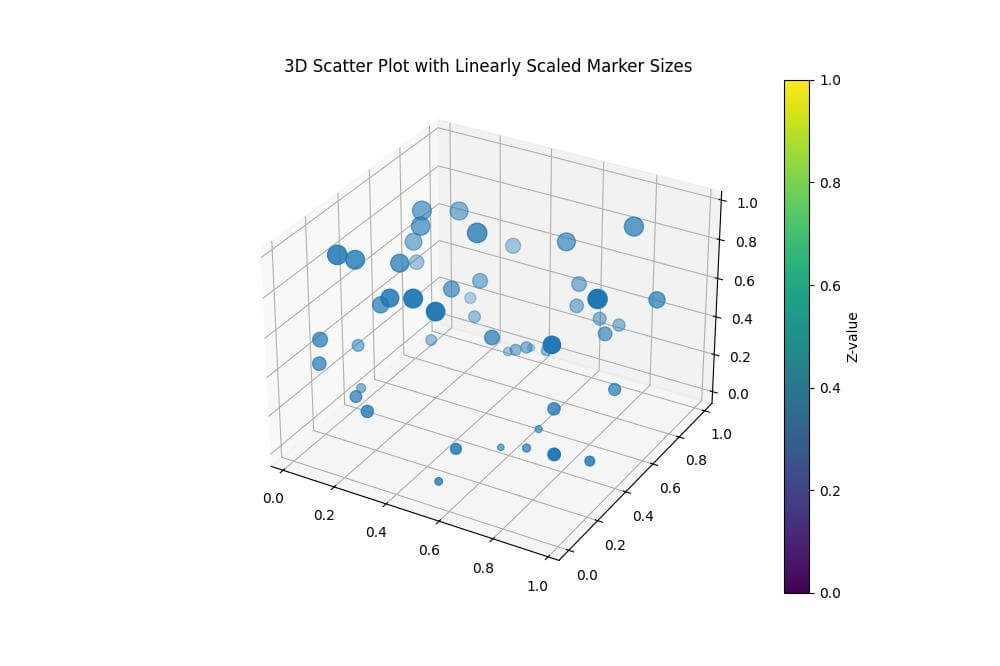
This code applies linear scaling to marker sizes by mapping z-values to sizes between 20 and 200.
Logarithmic Scaling
For data with a wide range of values, logarithmic scaling can be useful:
import numpy as np
import matplotlib.pyplot as plt

# Sample data with exponential distribution
np.random.seed(42)
x = np.random.rand(50)
y = np.random.rand(50)
z = np.random.exponential(scale=0.5, size=50)

# Logarithmic scaling of marker sizes
min_size = 20
max_size = 500
sizes = min_size + (max_size - min_size) * np.log1p(z) / np.log1p(z.max())
fig = plt.figure(figsize=(10, 8))
ax = fig.add_subplot(111, projection='3d')
scatter = ax.scatter(x, y, z, s=sizes)
plt.title("3D Scatter Plot with Logarithmically Scaled Marker Sizes")
plt.show()
Output:
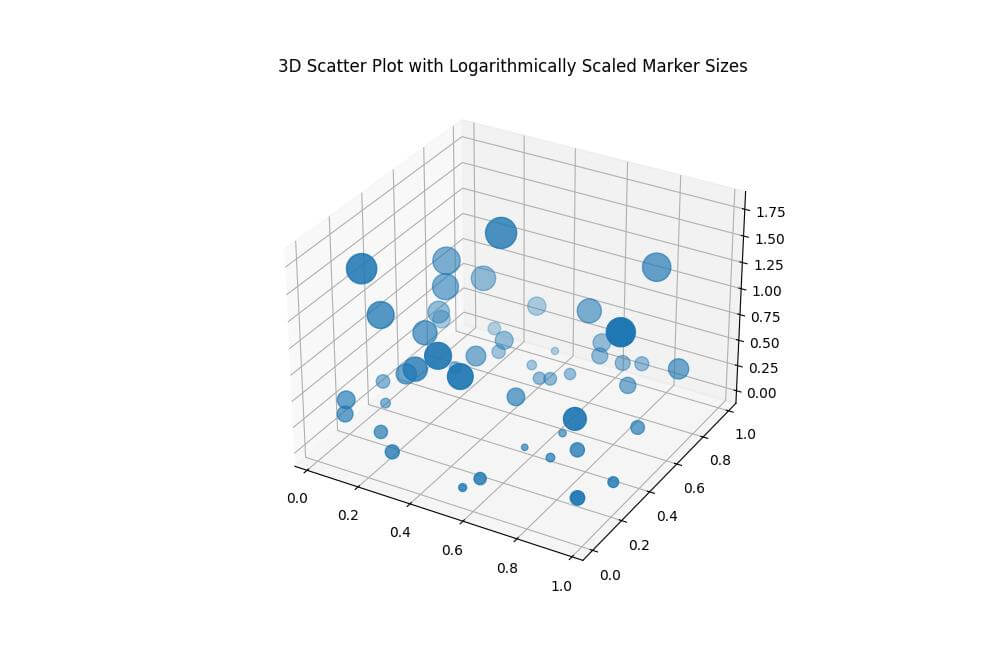
This code applies logarithmic scaling to marker sizes, which is useful for data with exponential distribution.
The resulting plot shows a more balanced representation of the z-values, even with a wide range of values.
Custom Scaling Functions
You can create custom scaling functions for specific needs:
import numpy as np
import matplotlib.pyplot as plt
def custom_scale(values, min_size=20, max_size=500):
    return min_size + (max_size - min_size) * np.tanh(values)
np.random.seed(42)
x = np.random.rand(50)
y = np.random.rand(50)
z = np.random.rand(50) * 5  # Values between 0 and 5
sizes = custom_scale(z)
fig = plt.figure(figsize=(10, 8))
ax = fig.add_subplot(111, projection='3d')
scatter = ax.scatter(x, y, z, s=sizes)
plt.title("3D Scatter Plot with Custom Scaled Marker Sizes")
plt.colorbar(scatter, label="Z-value")
plt.show()
Output:
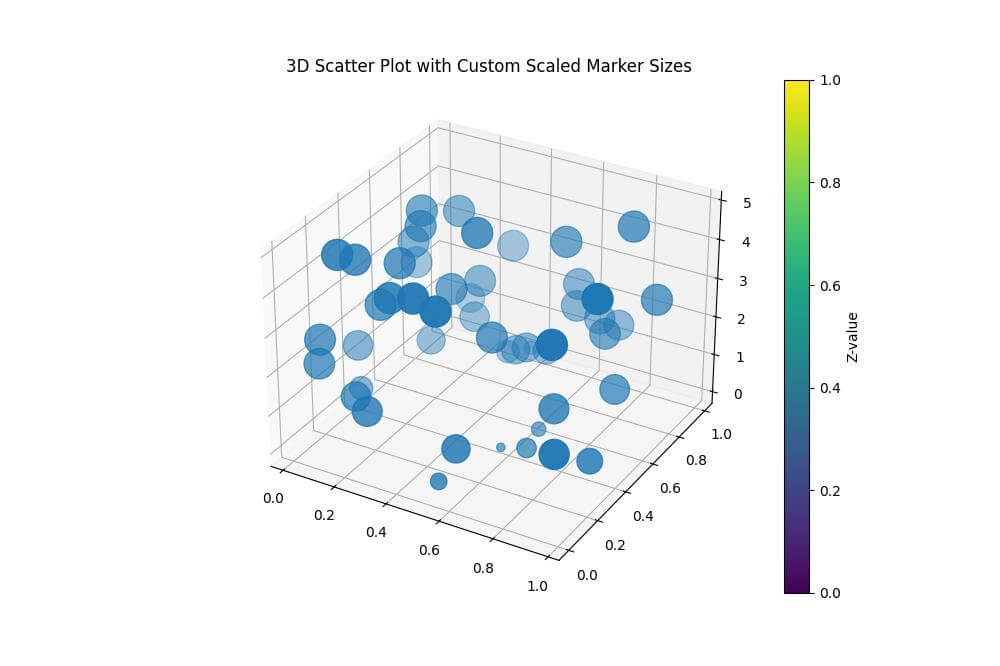
This code uses the hyperbolic tangent (tanh) function to show a custom scaling function.
This creates a smooth transition between minimum and maximum sizes, with more pronounced differences in the middle range of z-values.
Dynamic Marker Sizing
You can adjust marker sizes based on plot dimensions:
import numpy as np
import matplotlib.pyplot as plt
def size_to_points(size, fig, ax):
bbox = ax.get_window_extent().transformed(fig.dpi_scale_trans.inverted())
width, height = bbox.width, bbox.height
area_inches = width * height
return size * 72. * area_inches
np.random.seed(42)
x = np.random.rand(50)
y = np.random.rand(50)
z = np.random.rand(50)
fig = plt.figure(figsize=(10, 8))
ax = fig.add_subplot(111, projection='3d')
sizes = np.random.rand(50) * 0.05 # Sizes as fraction of plot area
point_sizes = size_to_points(sizes, fig, ax)
scatter = ax.scatter(x, y, z, s=point_sizes)
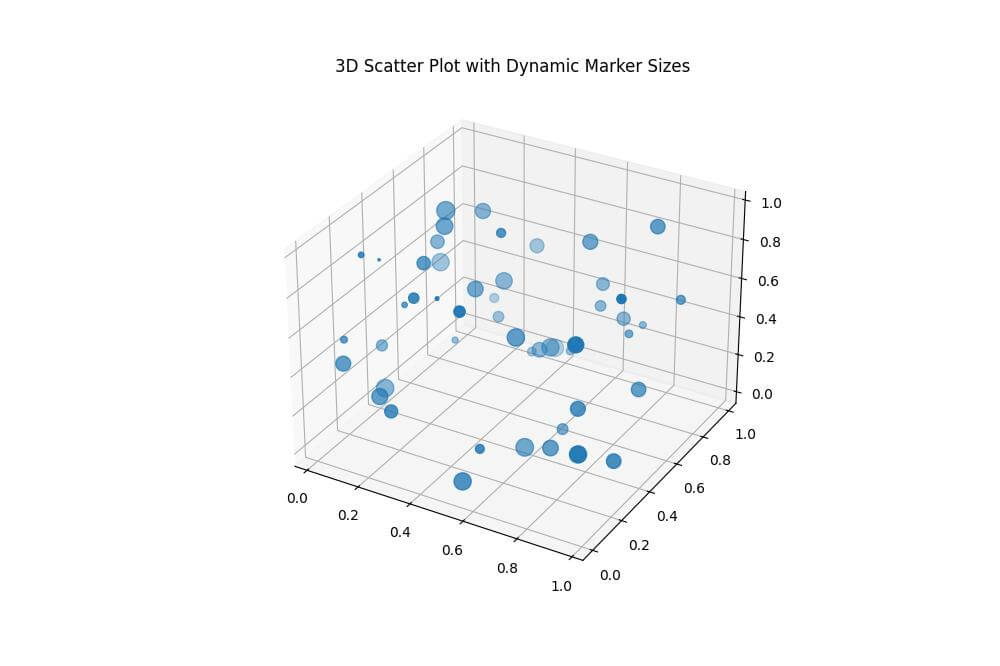
plt.title("3D Scatter Plot with Dynamic Marker Sizes")
plt.show()
Output:
Size Units and Conversions
Points vs. pixels
Matplotlib uses points for marker sizes, while some other libraries use pixels:
import numpy as np
import matplotlib.pyplot as plt

# Convert points to pixels
def points_to_pixels(points, dpi=72):
    return points * dpi / 72
np.random.seed(42)
x = np.random.rand(50)
y = np.random.rand(50)
z = np.random.rand(50)
fig = plt.figure(figsize=(10, 8))
ax = fig.add_subplot(111, projection='3d')
point_sizes = np.random.randint(20, 200, 50)
pixel_sizes = points_to_pixels(point_sizes)
scatter = ax.scatter(x, y, z, s=point_sizes)
plt.title("3D Scatter Plot with Point Sizes")
plt.show()
Output:
![]()
The points_to_pixels function converts point sizes to pixel sizes, which can be useful when comparing with other plotting libraries.
Convert Between Different Size Units
You can convert between different size units:
import numpy as np
import matplotlib.pyplot as plt
def mm_to_points(mm):
    return mm * 2.83465
def inches_to_points(inches):
    return inches * 72
np.random.seed(42)
x = np.random.rand(50)
y = np.random.rand(50)
z = np.random.rand(50)
fig = plt.figure(figsize=(10, 8))
ax = fig.add_subplot(111, projection='3d')
mm_sizes = np.random.uniform(1, 5, 50)  # Sizes in mm
point_sizes = mm_to_points(mm_sizes)
scatter = ax.scatter(x, y, z, s=point_sizes)
plt.title("3D Scatter Plot with Marker Sizes in mm")
plt.show()
Output:
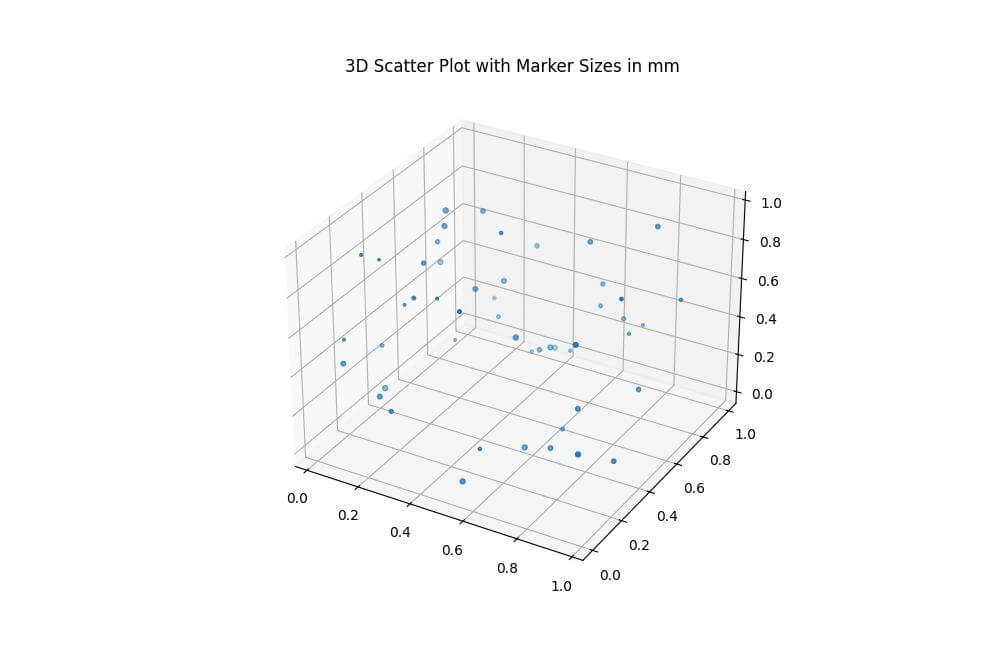
The mm_to_points and inches_to_points functions provide conversions from millimeters and inches to points, respectively.
Mokhtar is the founder of LikeGeeks.com. He is a seasoned technologist and accomplished author, with expertise in Linux system administration and Python development. Since 2010, Mokhtar has built an impressive career, transitioning from system administration to Python development in 2015. His work spans large corporations to freelance clients around the globe. Alongside his technical work, Mokhtar has authored some insightful books in his field. Known for his innovative solutions, meticulous attention to detail, and high-quality work, Mokhtar continually seeks new challenges within the dynamic field of technology.