Connect Two Points on Matplotlib 3D Scatter Plot in Python
In this tutorial, you’ll learn various methods to connect two points on a 3D scatter plot using Python.
We’ll discover how to visualize connections between points in three-dimensional space using Matplotlib.
Basic Scatter Plot
First, let’s create a basic 3D scatter plot with two points.
To create a basic 3D scatter plot with two points, use the following code:
import numpy as np
import matplotlib.pyplot as plt
from mpl_toolkits.mplot3d import Axes3D

# Create two points
point1 = np.array([1, 2, 3])
point2 = np.array([4, 5, 6])
fig = plt.figure(figsize=(10, 8))
ax = fig.add_subplot(111, projection='3d')
ax.scatter(*point1, c='r', s=100, label='Amr')
ax.scatter(*point2, c='b', s=100, label='Fatma')
ax.set_xlabel('X')
ax.set_ylabel('Y')
ax.set_zlabel('Z')
ax.set_title('3D Scatter Plot with Two Points')
ax.legend()
plt.show()
Output:
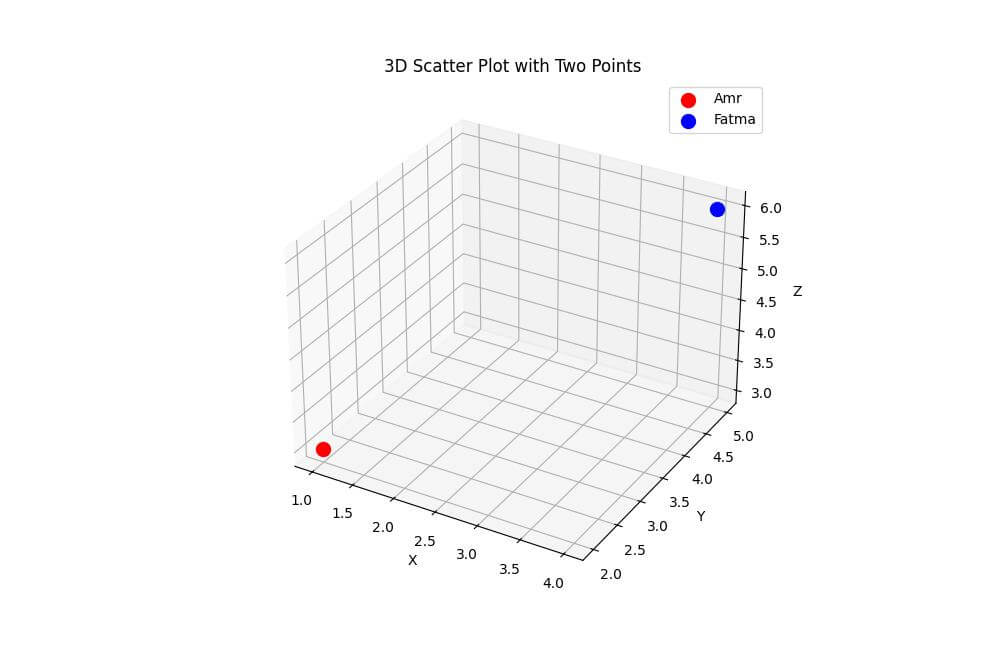
This code creates a 3D scatter plot with two points: Amr (red) and Fatma (blue).
The points are positioned at (1, 2, 3) and (4, 5, 6) respectively.
Using a Line
To connect the two points with a straight line, you can use the plot3D function:
ax.plot3D(*zip(point1, point2), c='g', linewidth=2)
ax.set_xlabel('X')
ax.set_ylabel('Y')
ax.set_zlabel('Z')
ax.set_title('3D Scatter Plot with Connected Points')
ax.legend()
plt.show()
Output:
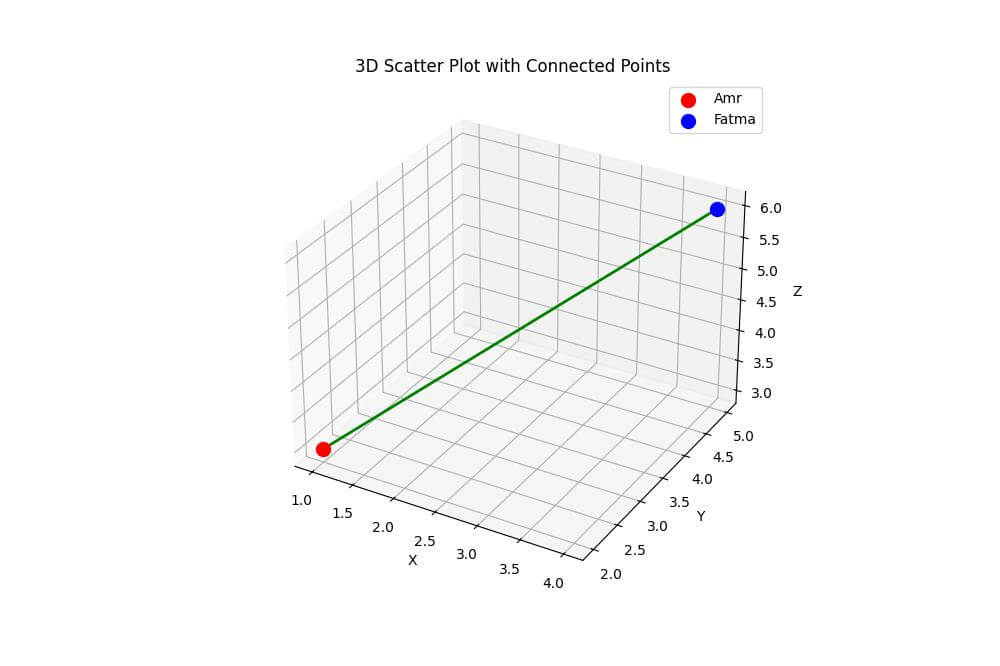
This code adds a green line connecting Amr and Fatma’s points using the plot3D function.
The zip function is used to create pairs of coordinates for the line.
Using Dotted or Dashed Lines
To create dotted or dashed lines between points, you can modify the linestyle parameter:
ax.plot3D([point1[0], point2[0]], [point1[1], point2[1]], [point1[2], point2[2]],
        c='g', linestyle=':', linewidth=2, label='Connection')
ax.set_xlabel('X')
ax.set_ylabel('Y')
ax.set_zlabel('Z')
ax.set_title('3D Scatter Plot with Two Points and Dotted Line')
ax.legend()
plt.show()
Output:
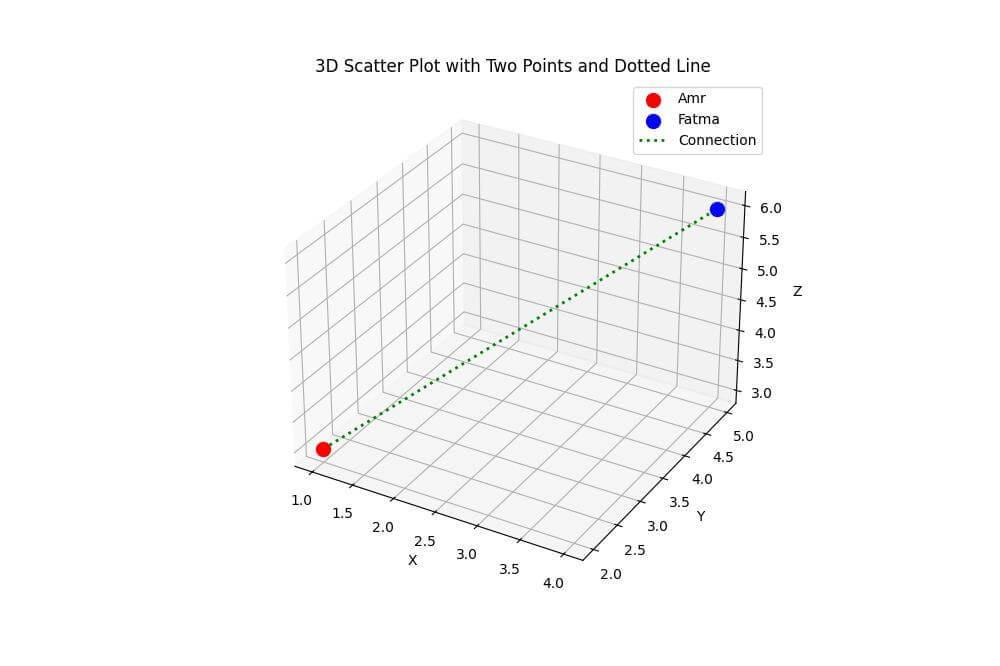
The dotted line is created using linestyle=':', while the dashed line uses linestyle='--'.
Using a Curve
To create a smooth curve between points, you can use a Bézier curve:
import numpy as np
import matplotlib.pyplot as plt
from mpl_toolkits.mplot3d import Axes3D
from scipy.special import comb
def bernstein_poly(i, n, t):
  return comb(n, i) * (t**(n-i)) * (1 - t)**i
def bezier_curve(points, nTimes=1000):
  nPoints = len(points)
  xPoints = np.array([p[0] for p in points])
  yPoints = np.array([p[1] for p in points])
  zPoints = np.array([p[2] for p in points])
  t = np.linspace(0.0, 1.0, nTimes)
  polynomial_array = np.array([bernstein_poly(i, nPoints-1, t) for i in range(0, nPoints)])
  xvals = np.dot(xPoints, polynomial_array)
  yvals = np.dot(yPoints, polynomial_array)
  zvals = np.dot(zPoints, polynomial_array)
  return xvals, yvals, zvals

# Create two points
point1 = np.array([1, 2, 3])
point2 = np.array([4, 5, 6])

# Create a control point for the curve
control_point = np.array([2.5, 5, 3.5])
fig = plt.figure(figsize=(10, 8))
ax = fig.add_subplot(111, projection='3d')
ax.scatter(*point1, c='r', s=100, label='Amr')
ax.scatter(*point2, c='b', s=100, label='Fatma')
curve_points = [point1, control_point, point2]
xvals, yvals, zvals = bezier_curve(curve_points)
ax.plot(xvals, yvals, zvals, c='g', linewidth=2, label='Bézier Curve')
ax.set_xlabel('X')
ax.set_ylabel('Y')
ax.set_zlabel('Z')
ax.set_title('3D Scatter Plot with Bézier Curve')
ax.legend()
plt.show()
Output:
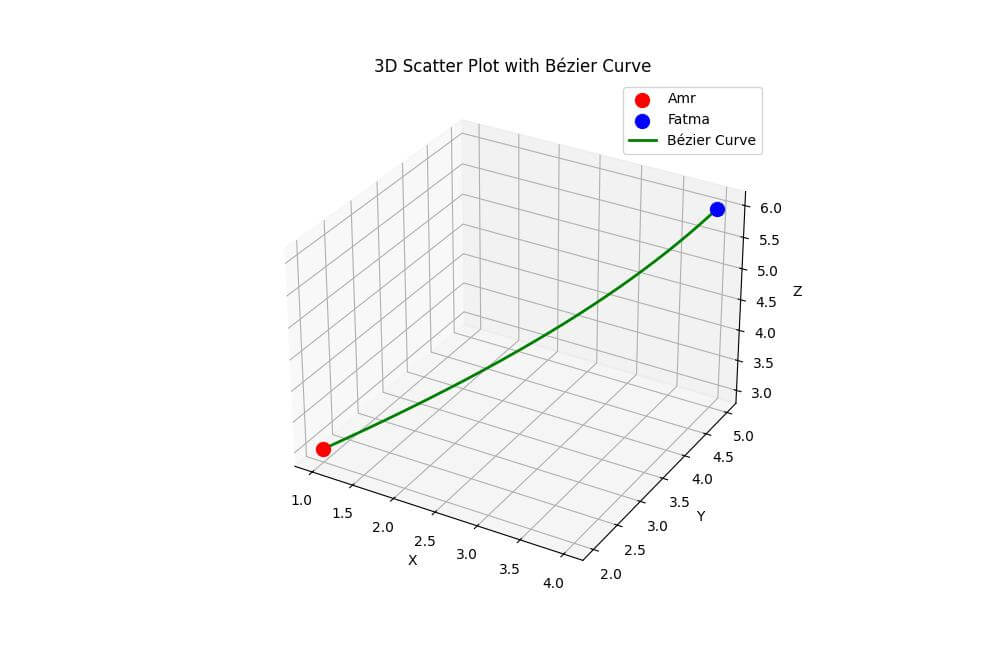
This code creates a smooth Bézier curve connecting Amr and Fatma’s points.
We define helper functions bernstein_poly and bezier_curve to calculate the curve’s points.
A control point is used to shape the curve.
Using Arrows
To connect points with arrows, you can use the quiver function:
direction = point2 - point1
ax.quiver(*point1, *direction, color='g', arrow_length_ratio=0.1, label='Arrow')
ax.set_xlabel('X')
ax.set_ylabel('Y')
ax.set_zlabel('Z')
ax.set_title('3D Scatter Plot with Arrow Connection')
ax.legend()
plt.show()
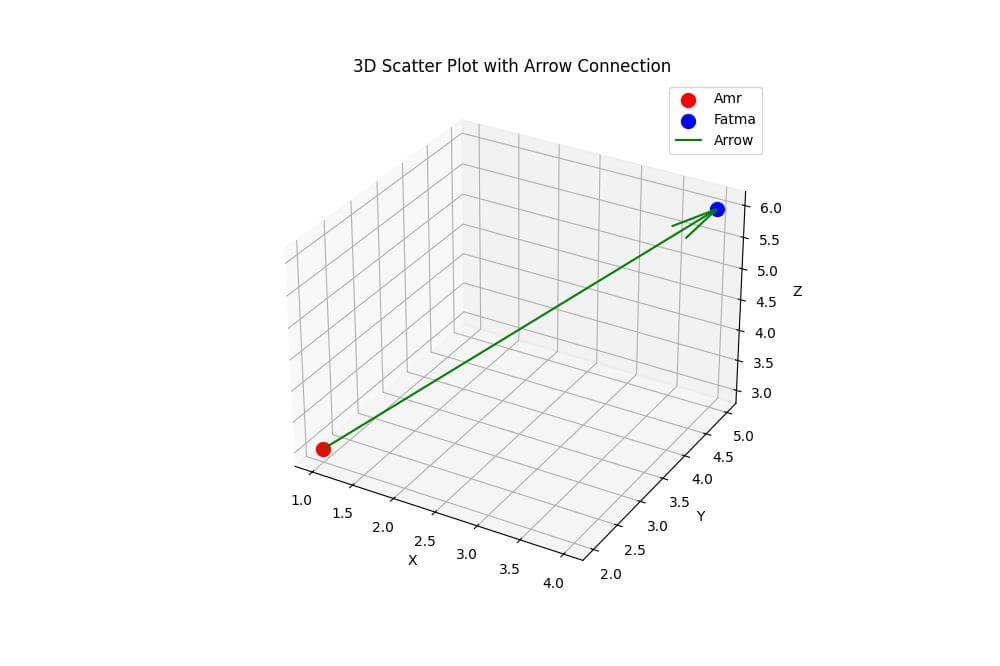
The direction vector is calculated as the difference between the two points, and arrow_length_ratio controls the size of the arrowhead.
Tubes or Cylinders
To create a tube or cylinder connecting the points, you can use the art3d module:
import numpy as np
import matplotlib.pyplot as plt
from mpl_toolkits.mplot3d import Axes3D
import mpl_toolkits.mplot3d.art3d as art3d
def cylinder_between_points(ax, p1, p2, radius=0.1, color='g'):
  v = p2 - p1
  mag = np.linalg.norm(v)
  v = v / mag
  not_v = np.array([1, 0, 0])
  if (v == not_v).all():
      not_v = np.array([0, 1, 0])
  n1 = np.cross(v, not_v)
  n1 /= np.linalg.norm(n1)
  n2 = np.cross(v, n1)
  t = np.linspace(0, mag, 100)
  theta = np.linspace(0, 2 * np.pi, 100)
  t, theta = np.meshgrid(t, theta)
  X, Y, Z = [p1[i] + v[i] * t + radius * np.sin(theta) * n1[i] + radius * np.cos(theta) * n2[i] for i in [0, 1, 2]]
  return ax.plot_surface(X, Y, Z, color=color, alpha=0.5)
point1 = np.array([1, 2, 3])
point2 = np.array([4, 5, 6])
fig = plt.figure(figsize=(10, 8))
ax = fig.add_subplot(111, projection='3d')
ax.scatter(*point1, c='r', s=100, label='Amr')
ax.scatter(*point2, c='b', s=100, label='Fatma')
cylinder = cylinder_between_points(ax, point1, point2)
ax.set_xlabel('X')
ax.set_ylabel('Y')
ax.set_zlabel('Z')
ax.set_title('3D Scatter Plot with Cylinder Connection')
ax.legend()
plt.show()
Output:
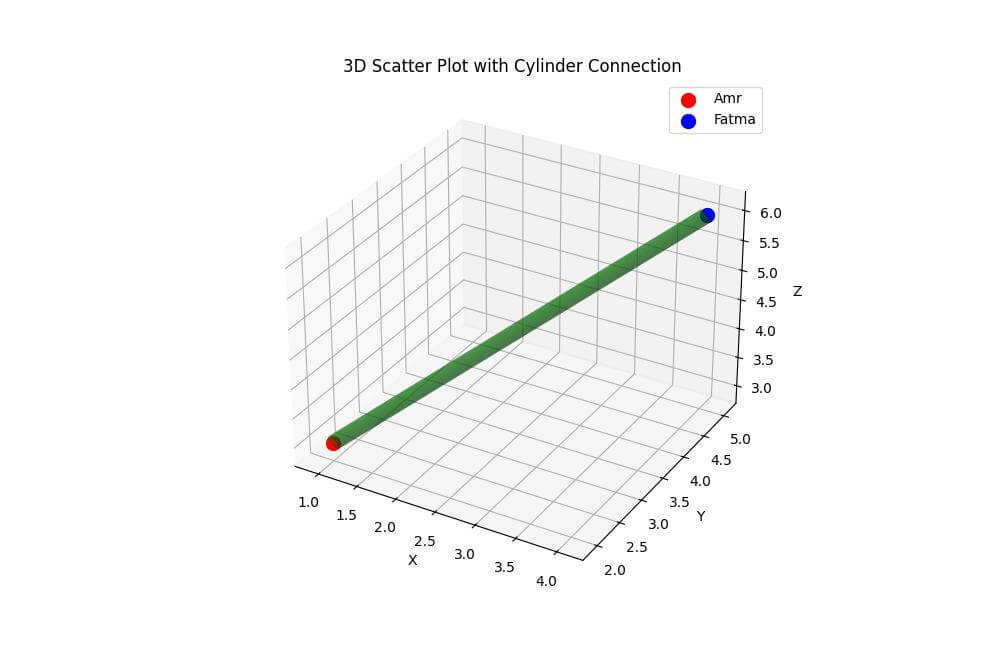
This code defines a cylinder_between_points function that creates a cylinder surface between two points.
The cylinder is then drawn using the plot_surface method of the 3D axes.
Mokhtar is the founder of LikeGeeks.com. He is a seasoned technologist and accomplished author, with expertise in Linux system administration and Python development. Since 2010, Mokhtar has built an impressive career, transitioning from system administration to Python development in 2015. His work spans large corporations to freelance clients around the globe. Alongside his technical work, Mokhtar has authored some insightful books in his field. Known for his innovative solutions, meticulous attention to detail, and high-quality work, Mokhtar continually seeks new challenges within the dynamic field of technology.