Plot 3D Sphere in Python Using Matplotlib
In this tutorial, you’ll learn how to plot a 3D sphere using Python.
You’ll use NumPy and Matplotlib to generate the sphere data and create visualizations.
Generate Sphere Data
To create a sphere, you’ll start by generating data points using spherical coordinates:
import numpy as np
theta = np.linspace(0, 2 * np.pi, 100)
phi = np.linspace(0, np.pi, 50)
theta, phi = np.meshgrid(theta, phi)
r = 1
This code generates a grid of theta and phi values that cover the entire sphere.
The radius is set to 1, but you can adjust it to change the size of the sphere.
Now, you’ll convert the spherical coordinates to Cartesian coordinates:
# Convert to Cartesian coordinates
x = r * np.sin(phi) * np.cos(theta)
y = r * np.sin(phi) * np.sin(theta)
z = r * np.cos(phi)
print(f"Shape of x, y, z: {x.shape}")
print(f"Min and max values - x: ({x.min():.2f}, {x.max():.2f}), y: ({y.min():.2f}, {y.max():.2f}), z: ({z.min():.2f}, {z.max():.2f})")
Output:
Shape of x, y, z: (50, 100)
Min and max values - x: (-1.00, 1.00), y: (-1.00, 1.00), z: (-1.00, 1.00)
The code converts spherical coordinates to Cartesian coordinates using the mathematical formulas.
The resulting x, y, and z arrays have a shape of (50, 100) corresponding to the number of phi and theta values.
The min and max values show that the sphere is centered at the origin with a radius of 1.
Plot the Sphere
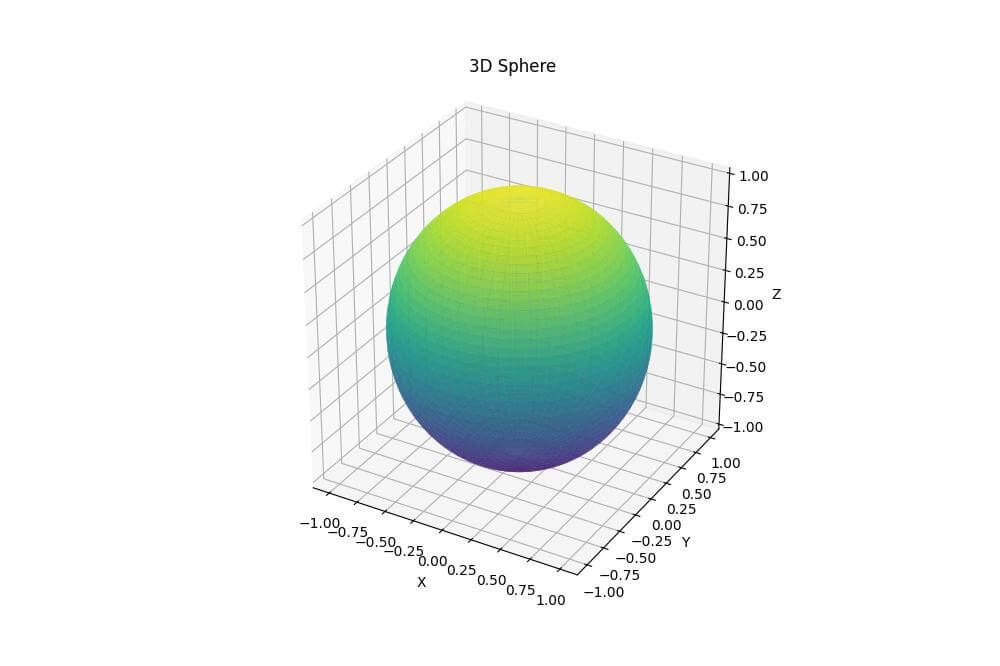
To create a 3D plot of the sphere, you can use Matplotlib plot_surface function:
import matplotlib.pyplot as plt
fig = plt.figure(figsize=(10, 10))
ax = fig.add_subplot(111, projection='3d')
ax.plot_surface(x, y, z, cmap='viridis', alpha=0.8)
ax.set_xlabel('X')
ax.set_ylabel('Y')
ax.set_zlabel('Z')
ax.set_title('3D Sphere')
ax.set_box_aspect((1, 1, 1))
plt.show()
Output:
The cmap parameter sets the color scheme, and alpha controls the transparency.
The set_box_aspect function ensures that the sphere appears perfectly round.
Add Points on the Sphere
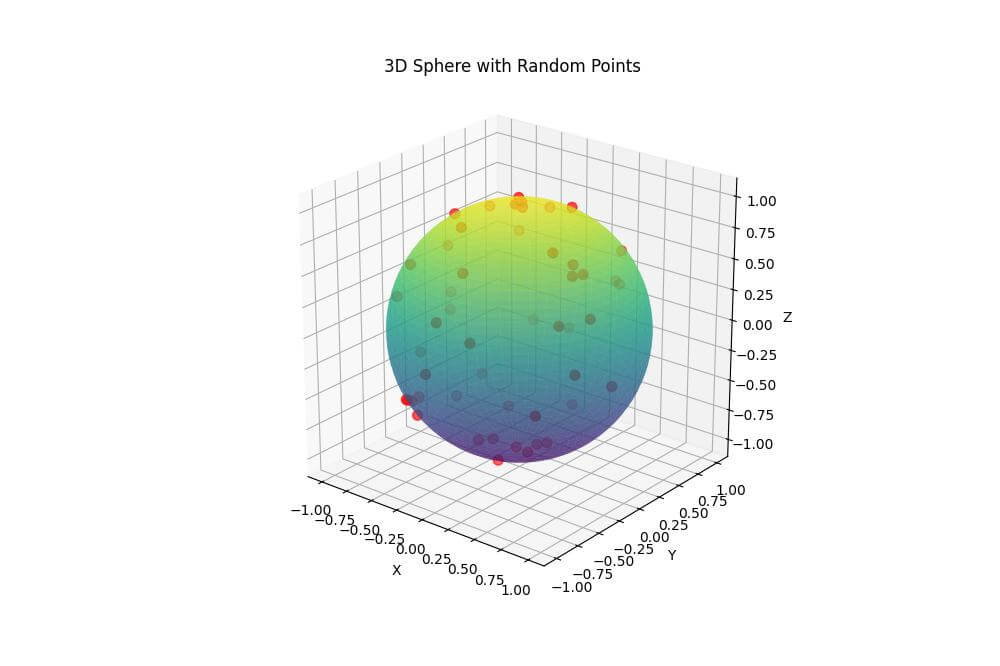
You can add points to the sphere to highlight specific locations or create patterns:
import numpy as np
import matplotlib.pyplot as plt
num_points = 50
theta_points = np.random.uniform(0, 2 * np.pi, num_points)
phi_points = np.random.uniform(0, np.pi, num_points)
x_points = r * np.sin(phi_points) * np.cos(theta_points)
y_points = r * np.sin(phi_points) * np.sin(theta_points)
z_points = r * np.cos(phi_points)
fig = plt.figure(figsize=(10, 10))
ax = fig.add_subplot(111, projection='3d')
ax.plot_surface(x, y, z, cmap='viridis', alpha=0.6)
ax.scatter(x_points, y_points, z_points, c='red', s=50)
ax.set_xlabel('X')
ax.set_ylabel('Y')
ax.set_zlabel('Z')
ax.set_title('3D Sphere with Random Points')
ax.set_box_aspect((1, 1, 1))
plt.show()
Output:
This code generates random points on the sphere’s surface and adds them to the plot using the scatter function.
The points are colored red and have a size of 50.
Multiple Spheres
Plot Nested Spheres
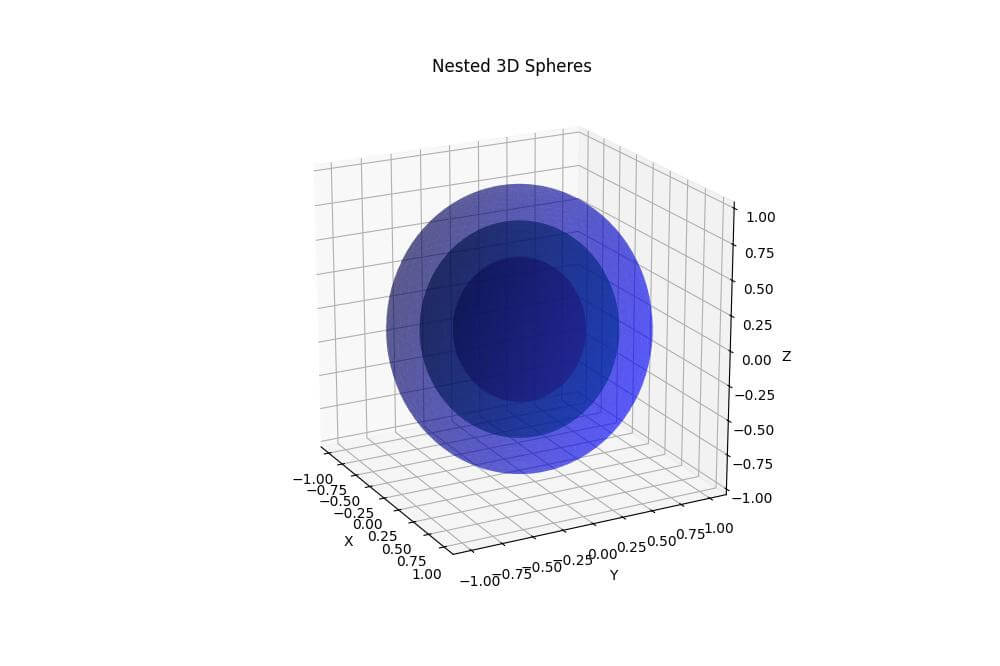
You can create nested spheres by plotting multiple spheres with different radii:
import numpy as np
import matplotlib.pyplot as plt
theta = np.linspace(0, 2 * np.pi, 100)
phi = np.linspace(0, np.pi, 50)
theta, phi = np.meshgrid(theta, phi)
radii = [0.5, 0.75, 1.0]
colors = ['red', 'green', 'blue']
fig = plt.figure(figsize=(10, 10))
ax = fig.add_subplot(111, projection='3d')
for r, color in zip(radii, colors):
    x = r * np.sin(phi) * np.cos(theta)
    y = r * np.sin(phi) * np.sin(theta)
    z = r * np.cos(phi)
    ax.plot_surface(x, y, z, color=color, alpha=0.4)
ax.set_xlabel('X')
ax.set_ylabel('Y')
ax.set_zlabel('Z')
ax.set_title('Nested 3D Spheres')
ax.set_box_aspect((1, 1, 1))
plt.show()
Output:
The alpha parameter is set to 0.4 to make the spheres semi-transparent so you to see the inner spheres.
Intersect Spheres
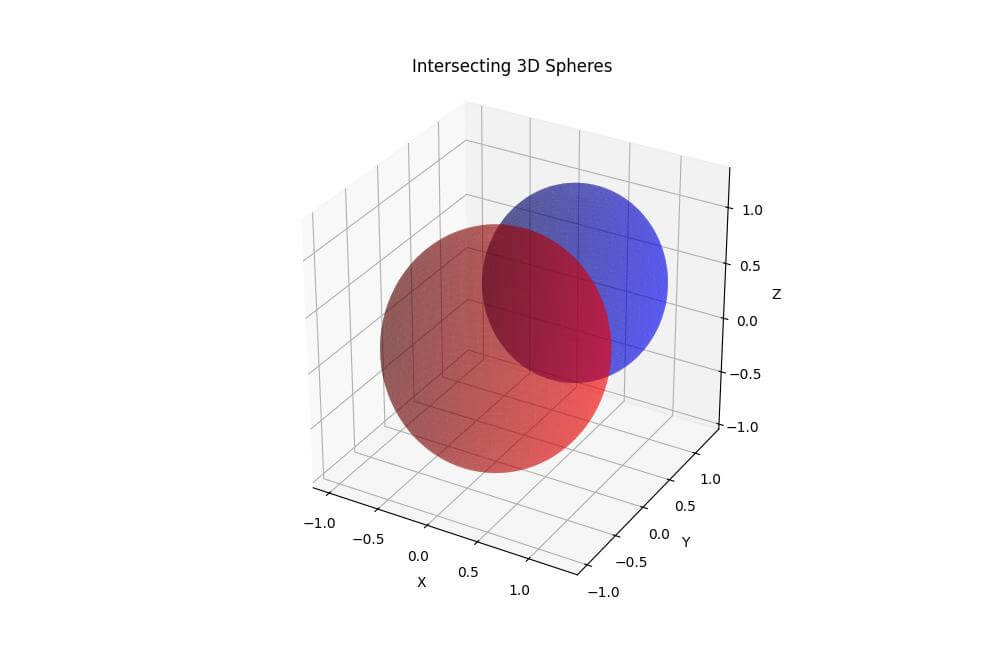
To create intersecting spheres, you can plot multiple spheres with different center points:
import numpy as np
import matplotlib.pyplot as plt
theta = np.linspace(0, 2 * np.pi, 100)
phi = np.linspace(0, np.pi, 50)
theta, phi = np.meshgrid(theta, phi)
centers = [(0, 0, 0), (0.5, 0.5, 0.5)]
radii = [1.0, 0.8]
colors = ['red', 'blue']
fig = plt.figure(figsize=(10, 10))
ax = fig.add_subplot(111, projection='3d')
for (cx, cy, cz), r, color in zip(centers, radii, colors):
    x = cx + r * np.sin(phi) * np.cos(theta)
    y = cy + r * np.sin(phi) * np.sin(theta)
    z = cz + r * np.cos(phi)
    ax.plot_surface(x, y, z, color=color, alpha=0.4)
ax.set_xlabel('X')
ax.set_ylabel('Y')
ax.set_zlabel('Z')
ax.set_title('Intersecting 3D Spheres')
ax.set_box_aspect((1, 1, 1))
plt.show()
Output:
This code creates two intersecting spheres with different center points, radii, and colors.
The spheres are made semi-transparent to show the intersection.
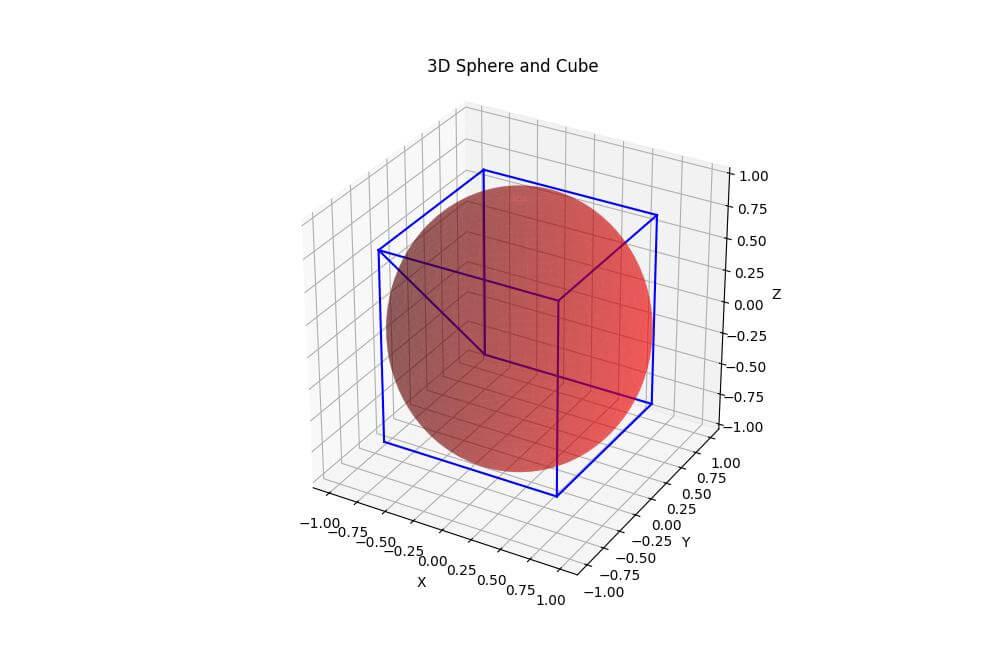
Combine Spheres with other 3D Objects
You can combine spheres with other 3D objects:
import numpy as np
import matplotlib.pyplot as plt
theta = np.linspace(0, 2 * np.pi, 100)
phi = np.linspace(0, np.pi, 50)
theta, phi = np.meshgrid(theta, phi)
r = 1
x_sphere = r * np.sin(phi) * np.cos(theta)
y_sphere = r * np.sin(phi) * np.sin(theta)
z_sphere = r * np.cos(phi)
cube_size = 1.5
cube_x = np.array([-1, 1, 1, -1, -1, 1, 1, -1]) * cube_size / 2
cube_y = np.array([-1, -1, 1, 1, -1, -1, 1, 1]) * cube_size / 2
cube_z = np.array([-1, -1, -1, -1, 1, 1, 1, 1]) * cube_size / 2
fig = plt.figure(figsize=(10, 10))
ax = fig.add_subplot(111, projection='3d')
ax.plot_surface(x_sphere, y_sphere, z_sphere, color='red', alpha=0.4)
for i in range(4):
    ax.plot3D(cube_x[i:i+2], cube_y[i:i+2], cube_z[i:i+2], 'b')
    ax.plot3D(cube_x[i:i+2], cube_y[i:i+2], cube_z[i+4:i+6], 'b')
    ax.plot3D([cube_x[i], cube_x[i]], [cube_y[i], cube_y[i]], [cube_z[i], cube_z[i+4]], 'b')
ax.set_xlabel('X')
ax.set_ylabel('Y')
ax.set_zlabel('Z')
ax.set_title('3D Sphere and Cube')
ax.set_box_aspect((1, 1, 1))
plt.show()
Output:
This code combines a sphere with a cube.
The sphere is plotted using the plot_surface function, while the cube is created by plotting its edges using plot3D.
Mokhtar is the founder of LikeGeeks.com. He is a seasoned technologist and accomplished author, with expertise in Linux system administration and Python development. Since 2010, Mokhtar has built an impressive career, transitioning from system administration to Python development in 2015. His work spans large corporations to freelance clients around the globe. Alongside his technical work, Mokhtar has authored some insightful books in his field. Known for his innovative solutions, meticulous attention to detail, and high-quality work, Mokhtar continually seeks new challenges within the dynamic field of technology.

