Best 3D Plotting Library in Python that fits Your Needs
This tutorial will guide you through the top 3D plotting libraries available in Python.
We’ll explore their unique features, strengths, and potential drawbacks to help you choose the library that best fits your needs.
For each library, you’ll find:
- A brief overview of its capabilities
- Visualizations of the resulting plots
- Unique advantages and disadvantages
Matplotlib
Matplotlib is a widely used plotting library in Python. For 3D plotting, you’ll use the mplot3d toolkit.
To create a simple 3D surface plot, you can use the plot_surface function:
import numpy as np
import matplotlib.pyplot as plt
from mpl_toolkits.mplot3d import Axes3D
x = np.linspace(-5, 5, 50)
y = np.linspace(-5, 5, 50)
X, Y = np.meshgrid(x, y)
Z = np.sin(np.sqrt(X**2 + Y**2))
fig = plt.figure()
ax = fig.add_subplot(111, projection='3d')
surf = ax.plot_surface(X, Y, Z, cmap='viridis')
fig.colorbar(surf)
plt.show()
Output:
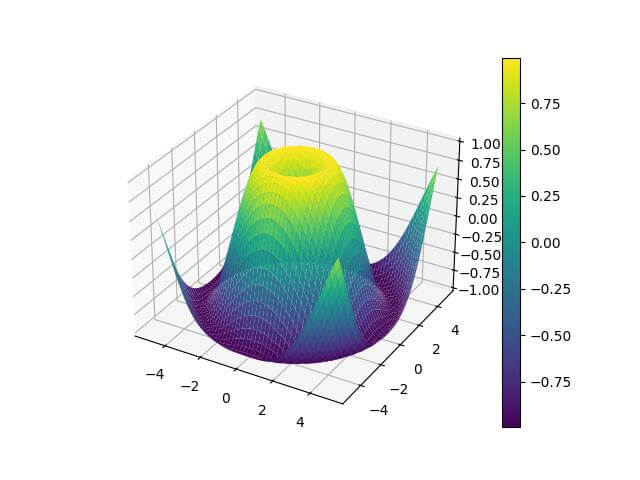
The plot shows a 3D surface representing a sinusoidal function of the distance from the origin.
Advantages:
– Extensive documentation and community support
– Integration with NumPy and Pandas
– Publication-quality figures
Disadvantages:
– Limited interactivity
– Slow for large datasets
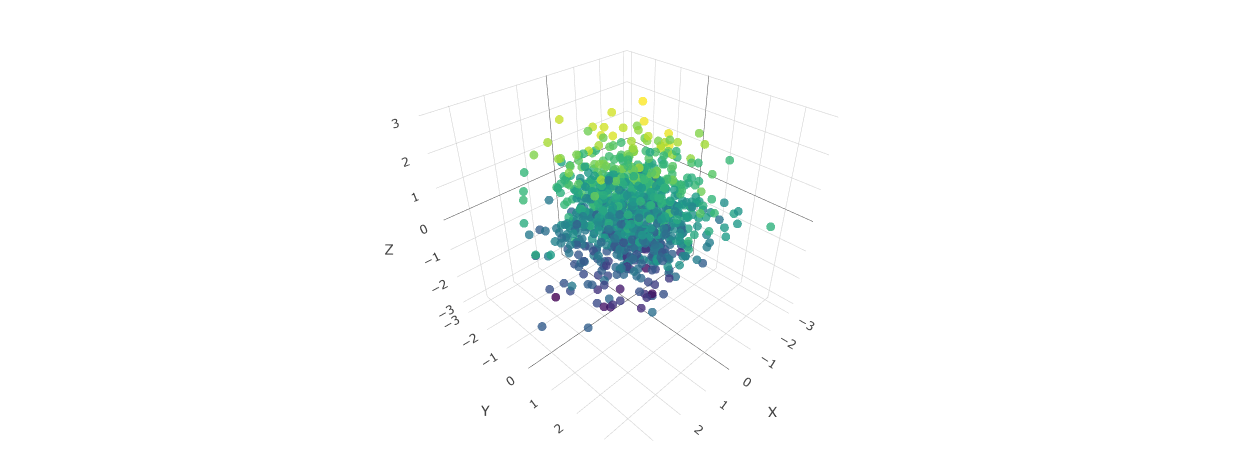
Plotly
Plotly offers interactive 3D plotting capabilities with a focus on web-based visualizations.
You can create an interactive 3D scatter plot using Plotly like this:
import plotly.graph_objects as go
import numpy as np
n = 1000
x = np.random.randn(n)
y = np.random.randn(n)
z = np.random.randn(n)
colors = np.random.randn(n)
fig = go.Figure(data=[go.Scatter3d(
    x=x, y=y, z=z,
    mode='markers',
    marker=dict(
        size=5,
        color=colors,
        colorscale='Viridis',
        opacity=0.8
    )
)])
fig.show()
Output:
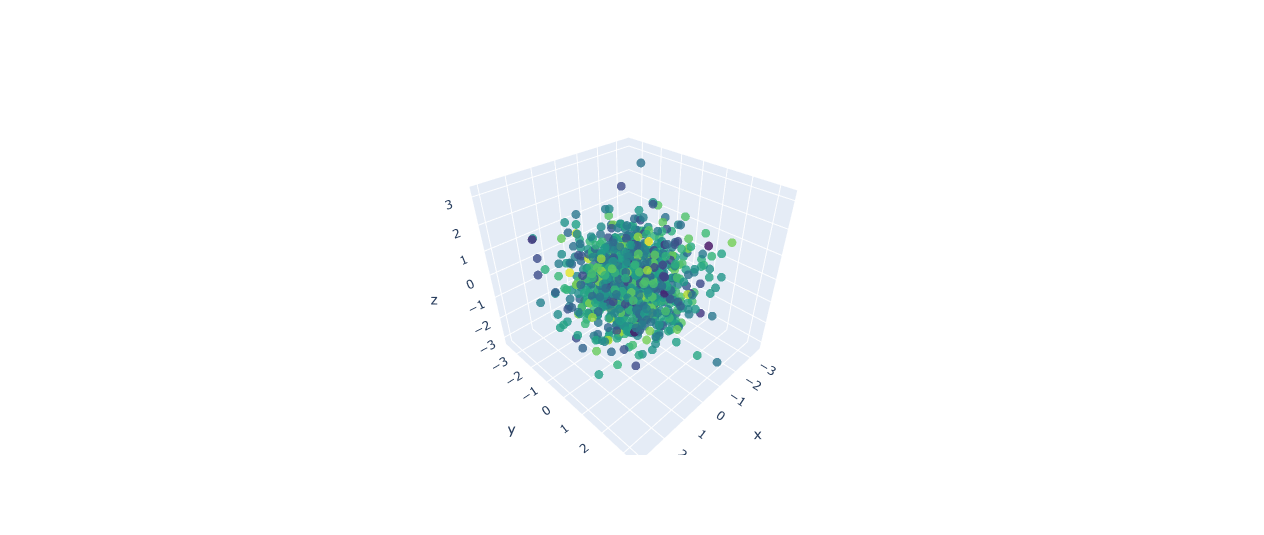
This creates an interactive 3D scatter plot with 1000 points colored based on a random value.
Advantages:
– Highly interactive plots
– Easy to create web-based visualizations
– Supports large datasets
Disadvantages:
– Steeper learning curve compared to Matplotlib
– Requires internet connection for some features
PyVista
PyVista is a powerful library for 3D plotting and mesh analysis.
To create a 3D plot of a sphere with PyVista:
import pyvista as pv
import numpy as np

# Create a sphere
sphere = pv.Sphere()

# Create a plotter
plotter = pv.Plotter()
plotter.add_mesh(sphere, color='red', show_edges=True)
plotter.show()
Output:
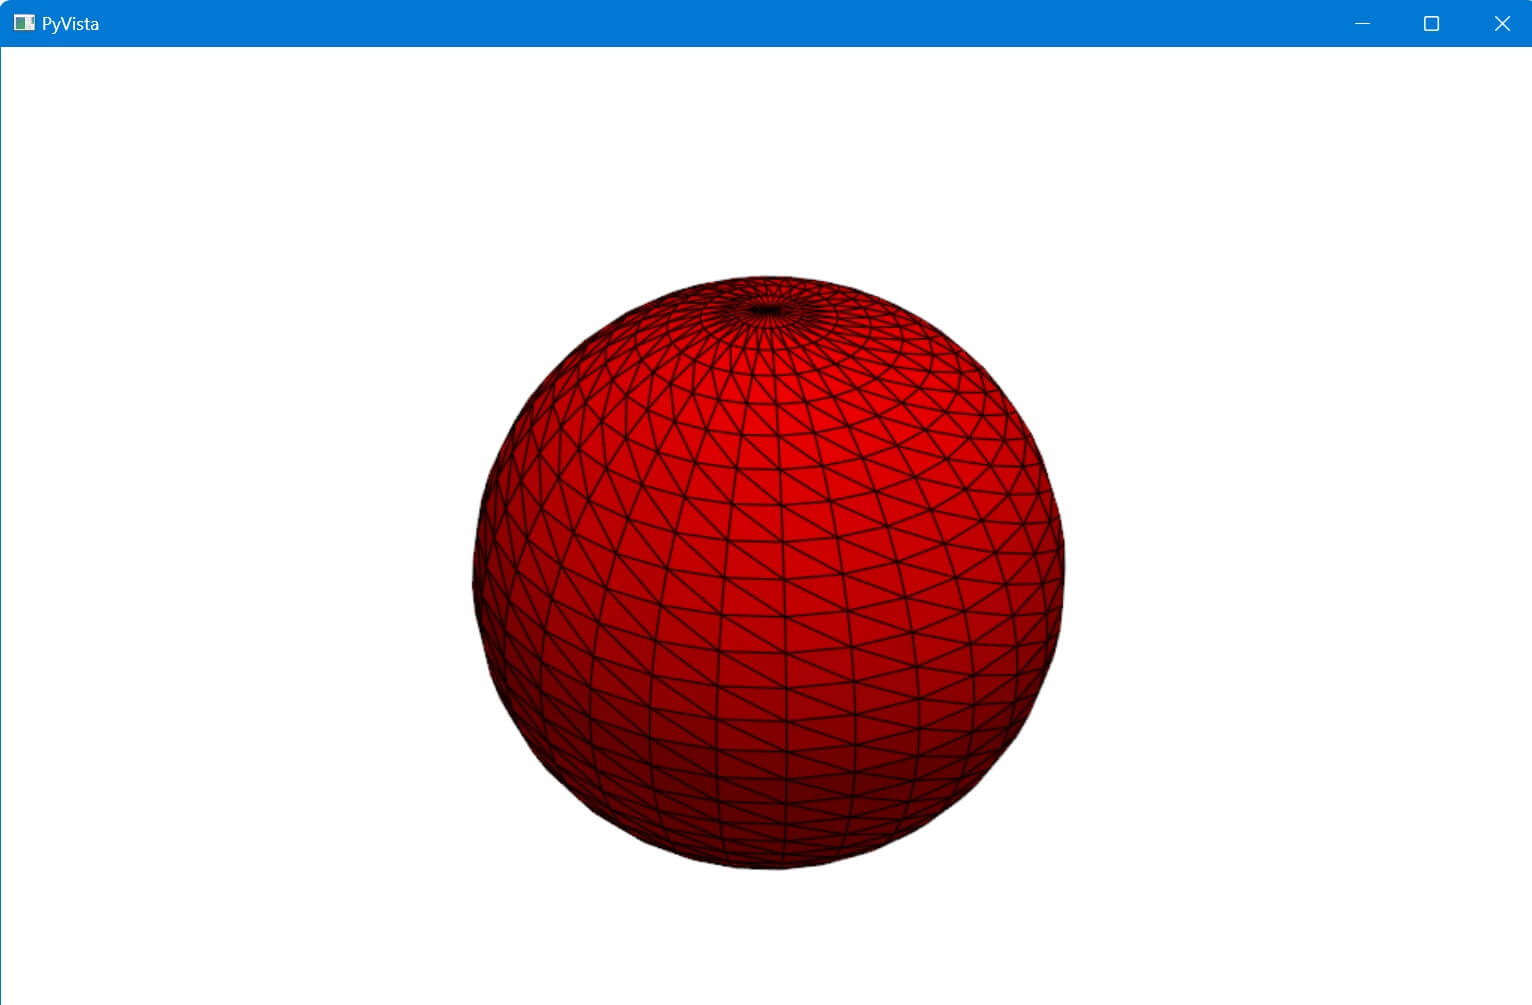
This code generates an interactive 3D plot of a red sphere with edges visible.
Advantages:
– Excellent for working with 3D meshes and point clouds
– Built on VTK, providing powerful visualization capabilities
– Good documentation and examples
Disadvantages:
– Primarily focused on scientific and engineering visualizations
– May be overkill for simple plotting tasks
Mayavi
Mayavi is a powerful 3D visualization library that provides a wide range of 3D plotting functions.
You can create a 3D surface plot using Mayavi like this:
import numpy as np
from mayavi import mlab

# Create a grid of points
x, y = np.ogrid[-2:2:100j, -2:2:100j]

# Create a function to plot (in this case, a simple sine wave)
z = np.sin(x*y)

# Create the 3D plot
mlab.figure(size=(800, 600))
surf = mlab.surf(x, y, z, colormap='viridis')
mlab.colorbar(surf, orientation='vertical')
mlab.xlabel('X')
mlab.ylabel('Y')
mlab.zlabel('Z')
mlab.show()
Output:
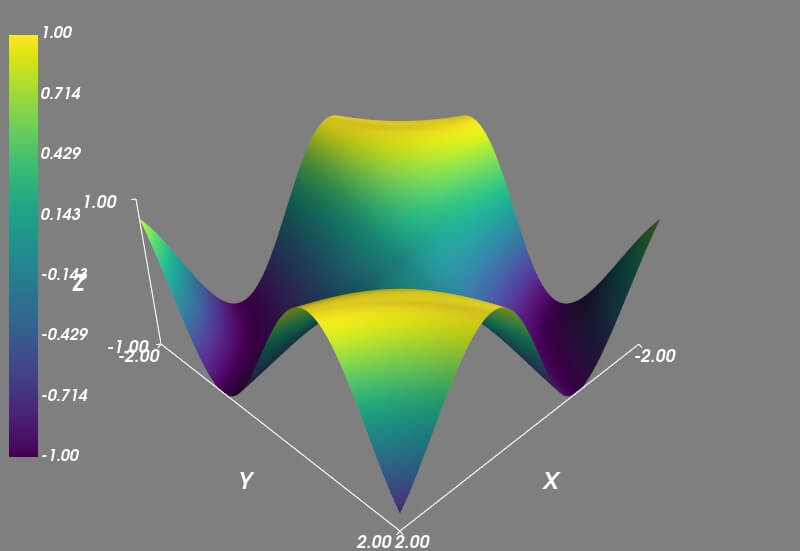
This creates a 3D contour plot of a Gaussian-like function.
Advantages:
– Powerful 3D visualization capabilities
– Good for scientific visualizations
– Supports a wide range of 3D plot types
Disadvantages:
– Can be complex to set up and use
– Less suitable for web-based applications
VisPy
VisPy is a high-performance plotting library that leverages the GPU for fast rendering.
To create a simple 3D scatter plot with VisPy:
import numpy as np
from vispy import app, scene
canvas = scene.SceneCanvas(keys='interactive', size=(800, 600), show=True)
view = canvas.central_widget.add_view()
N = 10000
pos = np.random.normal(size=(N, 3), scale=0.2)
colors = np.random.uniform(0, 1, size=(N, 4))

# Create scatter plot
scatter = scene.visuals.Markers()
scatter.set_data(pos, edge_color=None, face_color=colors, size=5)
view.add(scatter)
view.camera = 'turntable'
axis = scene.visuals.XYZAxis(parent=view.scene)
app.run()
Output:
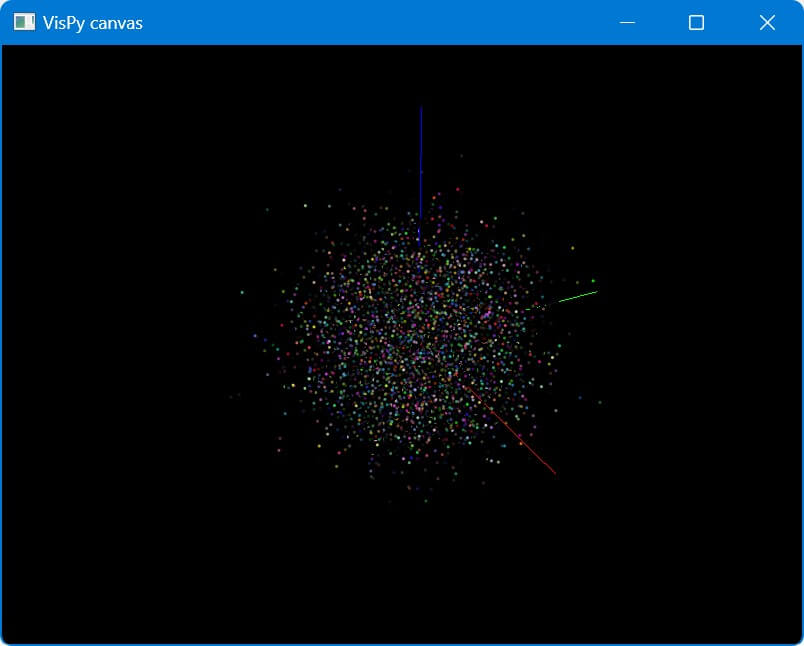
This code creates a 3D scatter plot with 10,000 points, each with a random color.
Advantages:
– High-performance rendering using OpenGL
– Suitable for large datasets and real-time visualizations
– Flexible and customizable
Disadvantages:
– Steeper learning curve
– Less documentation compared to more established libraries
VTK (Visualization Toolkit)
VTK is a powerful library for 3D computer graphics, image processing, and visualization.
You can create a 3D surface plot using VTK like this:
import vtk
import numpy as np
x = np.arange(-10, 10, 0.5)
y = np.arange(-10, 10, 0.5)
x, y = np.meshgrid(x, y)
r = np.sqrt(x**2 + y**2)
z = np.sin(r)
scalars = vtk.vtkFloatArray()
for value in z.flatten():
  scalars.InsertNextValue(value)
grid = vtk.vtkStructuredGrid()
grid.SetDimensions(x.shape[0], y.shape[1], 1)
points = vtk.vtkPoints()
for i in range(x.shape[0]):
  for j in range(y.shape[1]):
      points.InsertNextPoint(x[i, j], y[i, j], z[i, j])
grid.SetPoints(points)
grid.GetPointData().SetScalars(scalars)
mapper = vtk.vtkDataSetMapper()
mapper.SetInputData(grid)
actor = vtk.vtkActor()
actor.SetMapper(mapper)
renderer = vtk.vtkRenderer()
renderWindow = vtk.vtkRenderWindow()
renderWindow.AddRenderer(renderer)
renderWindowInteractor = vtk.vtkRenderWindowInteractor()
renderWindowInteractor.SetRenderWindow(renderWindow)
renderer.AddActor(actor)
renderWindow.Render()
renderWindowInteractor.Start()
Output:
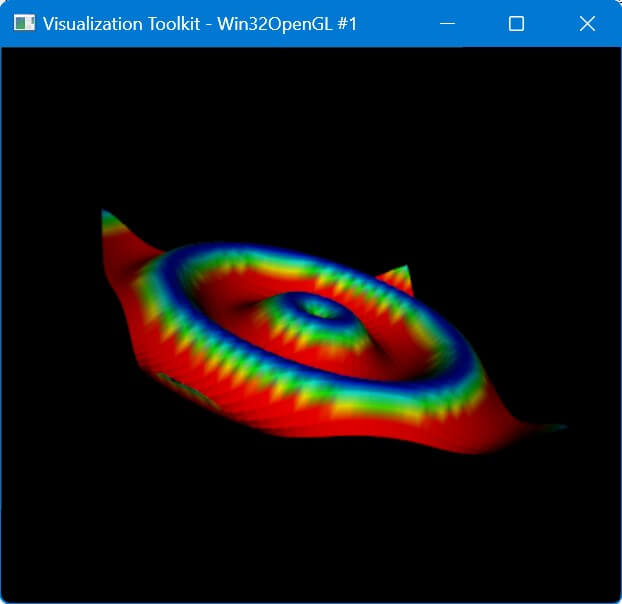
This code creates a 3D surface plot of a sinc function using VTK.
Advantages:
– Extremely powerful and flexible
– Supports a wide range of visualization techniques
– Good for complex scientific visualizations
Disadvantages:
– Steep learning curve
– More verbose code compared to higher-level libraries
Open3D
Open3D is a library designed for working with 3D data, particularly point clouds and meshes.
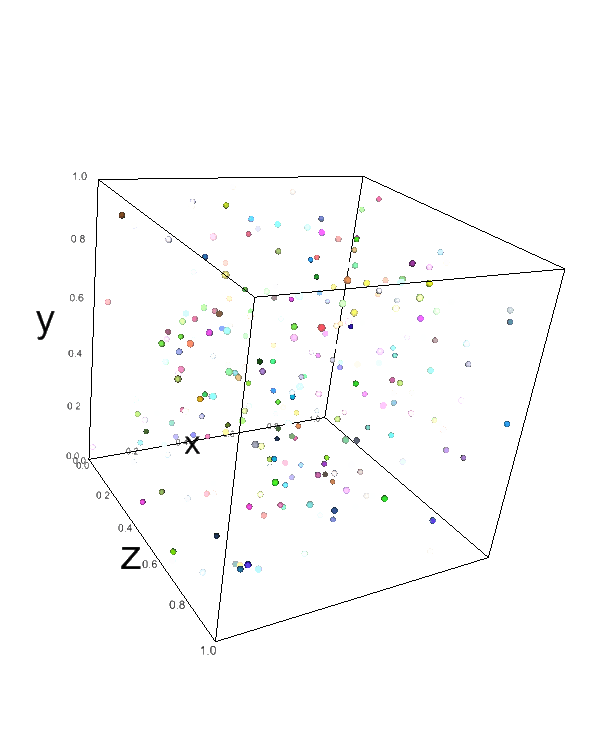
To visualize a point cloud using Open3D:
import open3d as o3d
import numpy as np

# Generate random point cloud
pcd = o3d.geometry.PointCloud()
pcd.points = o3d.utility.Vector3dVector(np.random.rand(1000, 3))
o3d.visualization.draw_geometries([pcd])
Output:
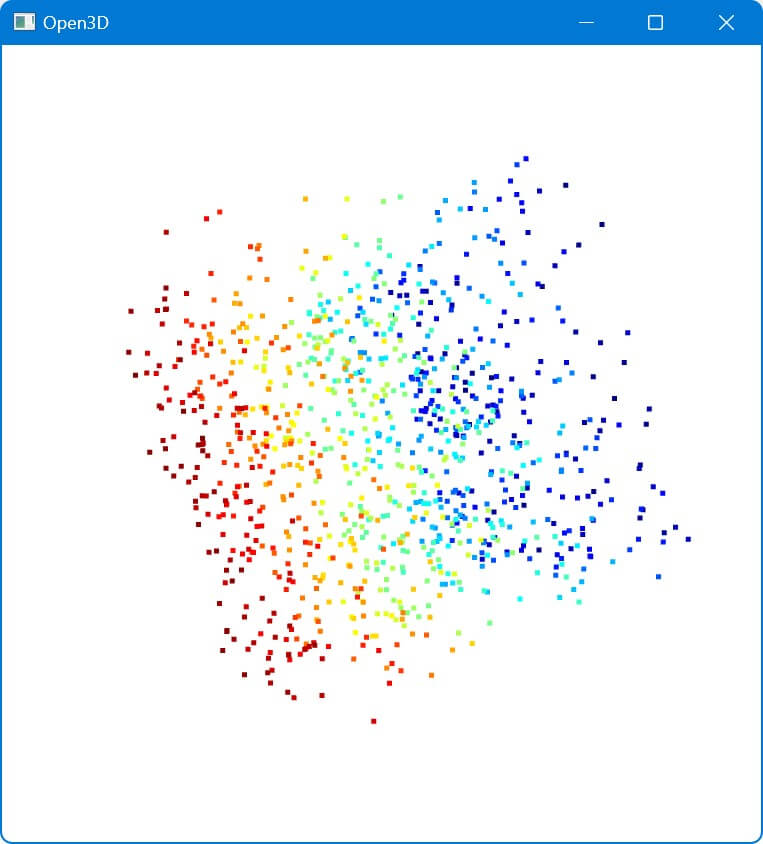
This code creates and visualizes a random 3D point cloud with 1000 points.
Advantages:
– Excellent for working with point clouds and 3D meshes
– Provides tools for 3D data processing and analysis
– Good performance for large datasets
Disadvantages:
– Focused on 3D data processing rather than general plotting
– May be overkill for simple visualization tasks
Dash
Dash is a framework for building analytical web applications, which includes 3D plotting capabilities.
You can create an interactive 3D scatter plot with Dash like this:
import dash
from dash import dcc
from dash import html
from dash.dependencies import Input, Output
import plotly.graph_objs as go
import numpy as np
app = dash.Dash(__name__)
app.layout = html.Div([
    dcc.Graph(id='3d-scatter')
])
@app.callback(Output('3d-scatter', 'figure'),
              Input('3d-scatter', 'relayoutData'))
def update_graph(relayoutData):
    x = np.random.randn(1000)
    y = np.random.randn(1000)
    z = np.random.randn(1000)
    return {
        'data': [go.Scatter3d(
            x=x,
            y=y,
            z=z,
            mode='markers',
            marker=dict(
                size=5,
                color=z,
                colorscale='Viridis',
                opacity=0.8
            )
        )],
        'layout': go.Layout(
            margin={'l': 0, 'r': 0, 'b': 0, 't': 0},
            scene=dict(
                xaxis=dict(title='X'),
                yaxis=dict(title='Y'),
                zaxis=dict(title='Z')
            )
        )
    }
if __name__ == '__main__':
    app.run_server(debug=True)
Output:
This code creates a web application with an interactive 3D scatter plot.
Advantages:
– Combines plotting with web application development
– Interactive and responsive plots
– Good for creating dashboards
Disadvantages:
– Requires web development knowledge
– More complex setup compared to standalone plotting libraries
Ipyvolume
Ipyvolume is a Python library for visualizing 3D volumes and glyphs in Jupyter notebooks.
To create a 3D scatter plot with Ipyvolume:
import ipyvolume as ipv
import numpy as np
x, y, z = np.random.random((3, 1000))
colors = np.random.random(1000)
fig = ipv.figure()
ipv.scatter(x, y, z, color=colors, marker='sphere')
ipv.show()
Output:
This creates an interactive 3D scatter plot with 1000 points colored based on a random value.
Advantages:
– Easy to use in Jupyter notebooks
– Interactive 3D visualizations
– Good for volumetric data
Disadvantages:
– Limited to Jupyter environment
– Less suitable for standalone applications
PyQtGraph
PyQtGraph is a pure-Python graphics and GUI library built on PyQt/PySide and numpy.
To create a 3D scatter plot using PyQtGraph:
import pyqtgraph.opengl as gl
from pyqtgraph.Qt import QtCore, QtWidgets
import numpy as np
app = QtWidgets.QApplication([])
w = gl.GLViewWidget()
w.show()
w.setWindowTitle('PyQtGraph 3D Scatter Plot')
w.setCameraPosition(distance=40)
g = gl.GLGridItem()
w.addItem(g)
pos = np.random.random((1000, 3))
color = np.random.random((1000, 4))
size = np.random.random((1000)) * 10
sp = gl.GLScatterPlotItem(pos=pos, color=color, size=size)
w.addItem(sp)
if __name__ == '__main__':
  import sys
  if (sys.flags.interactive != 1) or not hasattr(QtCore, 'PYQT_VERSION'):
      QtWidgets.QApplication.instance().exec()
Output:
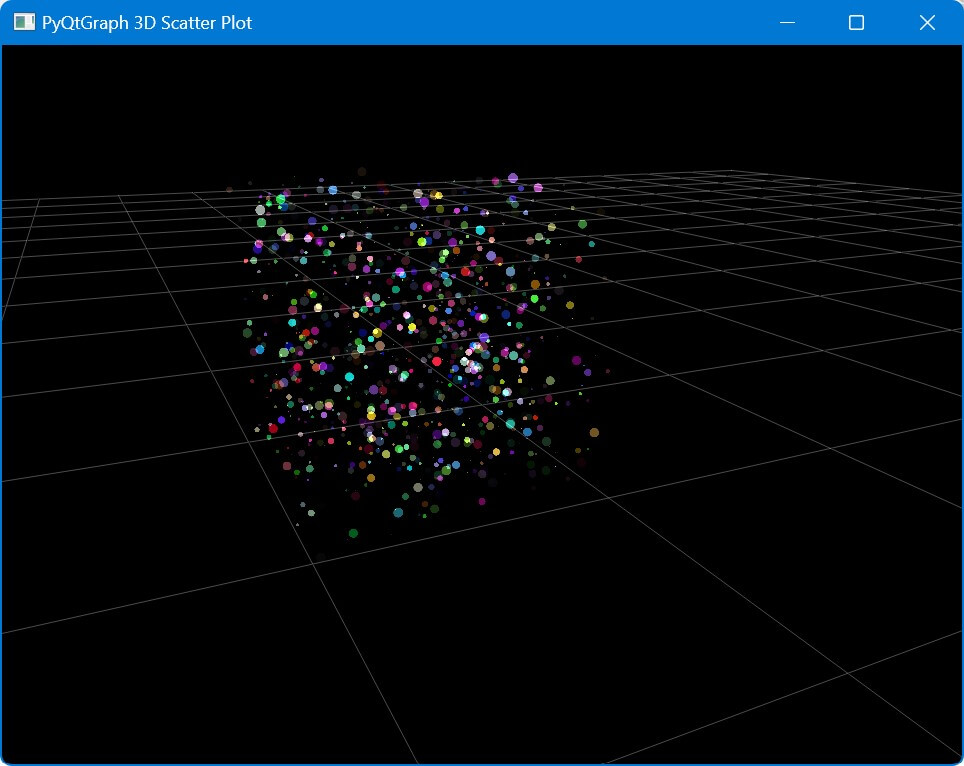
This code creates an interactive 3D scatter plot with 1000 points of varying sizes and colors.
Advantages:
– Fast performance for real-time data visualization
– Good integration with Qt for building GUIs
– Supports both 2D and 3D plotting
Disadvantages:
– Less extensive documentation compared to matplotlib
– Primarily designed for real-time plotting, may be overkill for static plots
Conclusion
Matplotlib and Plotly are widely used, PyVista and VTK excel at scientific visualizations, Mayavi and VisPy offer powerful 3D capabilities, while Dash is great for creating interactive web-based visualizations.
The choice of library depends on your specific needs, such as interactivity requirements, dataset size, and the complexity of the visualizations you want to create.
Mokhtar is the founder of LikeGeeks.com. He is a seasoned technologist and accomplished author, with expertise in Linux system administration and Python development. Since 2010, Mokhtar has built an impressive career, transitioning from system administration to Python development in 2015. His work spans large corporations to freelance clients around the globe. Alongside his technical work, Mokhtar has authored some insightful books in his field. Known for his innovative solutions, meticulous attention to detail, and high-quality work, Mokhtar continually seeks new challenges within the dynamic field of technology.