Create 3D Stem Plot in Python Using Matplotlib
In this tutorial, you’ll learn how to create 3D stem plots using Python. Stem plots are excellent for visualizing discrete data points in three-dimensional space.
We’ll use the Matplotlib library to generate these plots.
Data Preparation
To create a 3D stem plot, you need three-dimensional data. Let’s generate some sample data using NumPy:
import numpy as np
x = np.linspace(-5, 5, 10)
y = np.linspace(-5, 5, 10)
X, Y = np.meshgrid(x, y)
Z = np.sin(np.sqrt(X**2 + Y**2))
print(f"X shape: {X.shape}")
print(f"Y shape: {Y.shape}")
print(f"Z shape: {Z.shape}")
Output:
X shape: (10, 10)
Y shape: (10, 10)
Z shape: (10, 10)
The generated data consists of 10×10 grids for X, Y, and Z coordinates.
To create a stem plot, you need to reshape the data into 1D arrays:
# Reshape data for stem plot
x_stem = X.flatten()
y_stem = Y.flatten()
z_stem = Z.flatten()
print(f"x_stem shape: {x_stem.shape}")
print(f"y_stem shape: {y_stem.shape}")
print(f"z_stem shape: {z_stem.shape}")
Output:
x_stem shape: (100,)
y_stem shape: (100,)
z_stem shape: (100,)
The reshaped data now contains 100 points for each dimension, ready for the stem plot.
Basic 3D Stem Plot
To create 3D plots in Matplotlib, you need to import the mplot3d toolkit:
import matplotlib.pyplot as plt
from mpl_toolkits.mplot3d import Axes3D
Set up the figure and 3D axes for your stem plot:
fig = plt.figure(figsize=(10, 8))
ax = fig.add_subplot(111, projection='3d')
Create a custom function to generate the 3D stem plot:
def stem3D(ax, x, y, z, **kwargs):
    for xi, yi, zi in zip(x, y, z):
        line = ax.plot([xi, xi], [yi, yi], [0, zi], **kwargs)
        ax.scatter(xi, yi, zi, c=line[0].get_color())

# Create the 3D stem plot
stem3D(ax, x_stem, y_stem, z_stem, linewidth=1, color='b')
ax.set_xlabel('X')
ax.set_ylabel('Y')
ax.set_zlabel('Z')
ax.set_title('3D Stem Plot')
plt.show()
Output:
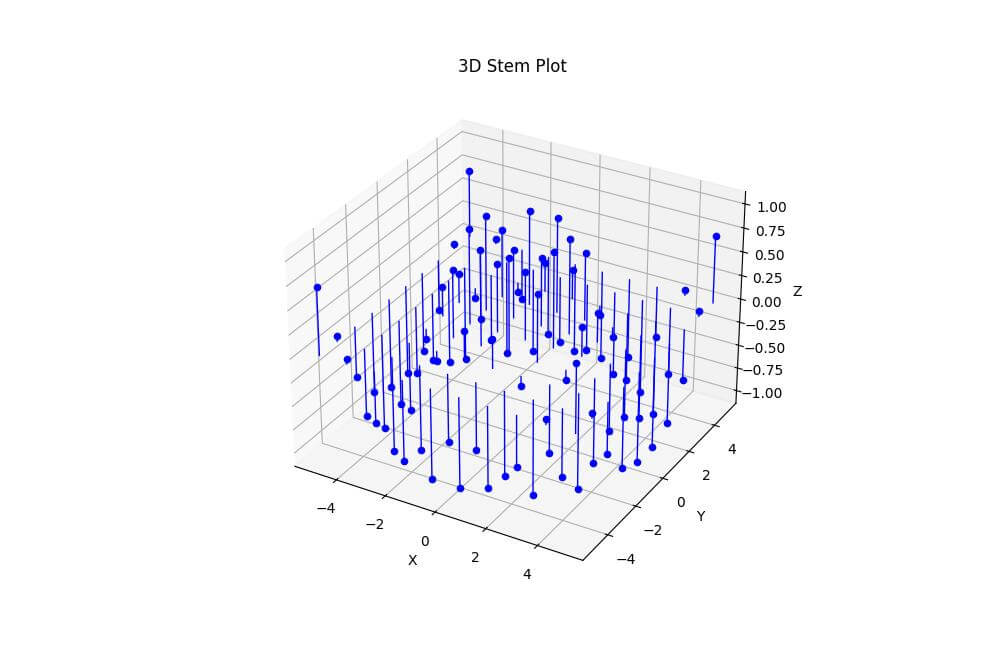
This code creates a basic 3D stem plot with blue stems and markers.
Customize Stem Appearance
Adjust Stem Colors
You can use a colormap to assign different colors to stems based on their height:
import matplotlib.cm as cm
def stem3D(ax, x, y, z, **kwargs):
    for xi, yi, zi, color in zip(x, y, z, kwargs['color']):
        line = ax.plot([xi, xi], [yi, yi], [0, zi], color=color, linewidth=kwargs.get('linewidth', 1))
        ax.scatter(xi, yi, zi, c=[color])
fig = plt.figure(figsize=(10, 8))
ax = fig.add_subplot(111, projection='3d')
ax.set_xlabel('X')
ax.set_ylabel('Y')
ax.set_zlabel('Z')
ax.set_title('3D Stem Plot')

# Normalize colors
colors = cm.viridis(z_stem / z_stem.max())
stem3D(ax, x_stem, y_stem, z_stem, linewidth=1, color=colors)
plt.show()
Output:
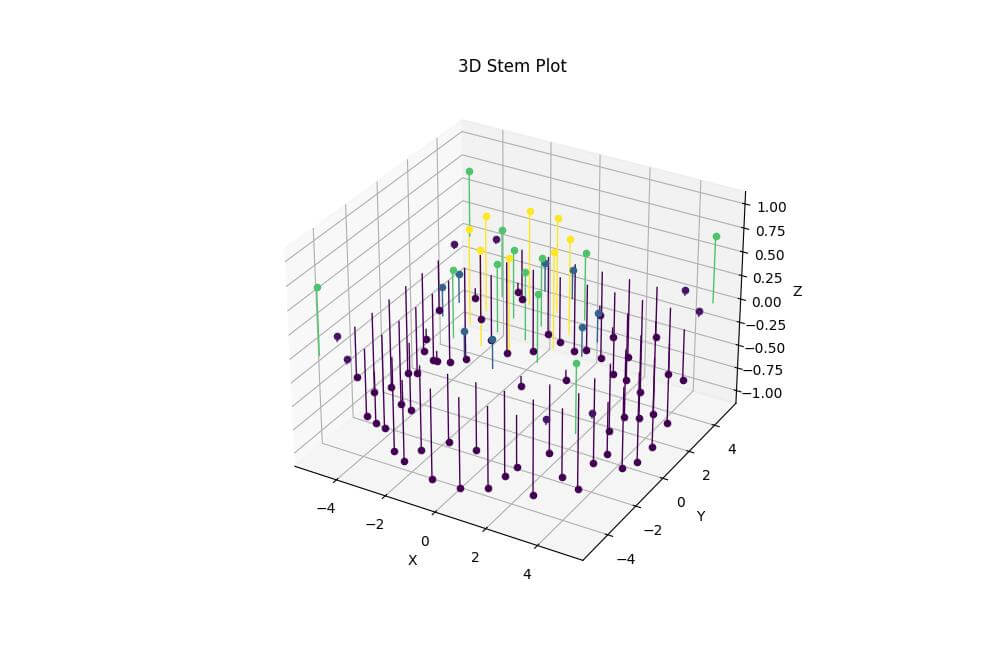
This code applies the ‘viridis’ colormap to the stems.
Modify Stem Line Width and Style
You can customize the appearance of the stems by adjusting their width and style using linewidth and linestyle parameters:
def stem3D(ax, x, y, z, **kwargs):
    for xi, yi, zi, color in zip(x, y, z, kwargs['color']):
        line = ax.plot([xi, xi], [yi, yi], [0, zi], color=color, linewidth=kwargs.get('linewidth', 1), linestyle='--')
        ax.scatter(xi, yi, zi, c=[color])
fig = plt.figure(figsize=(10, 8))
ax = fig.add_subplot(111, projection='3d')
ax.set_xlabel('X')
ax.set_ylabel('Y')
ax.set_zlabel('Z')
ax.set_title('3D Stem Plot')
colors = cm.viridis(z_stem / z_stem.max())
stem3D(ax, x_stem, y_stem, z_stem, linewidth=4, color=colors)
plt.show()
Output:
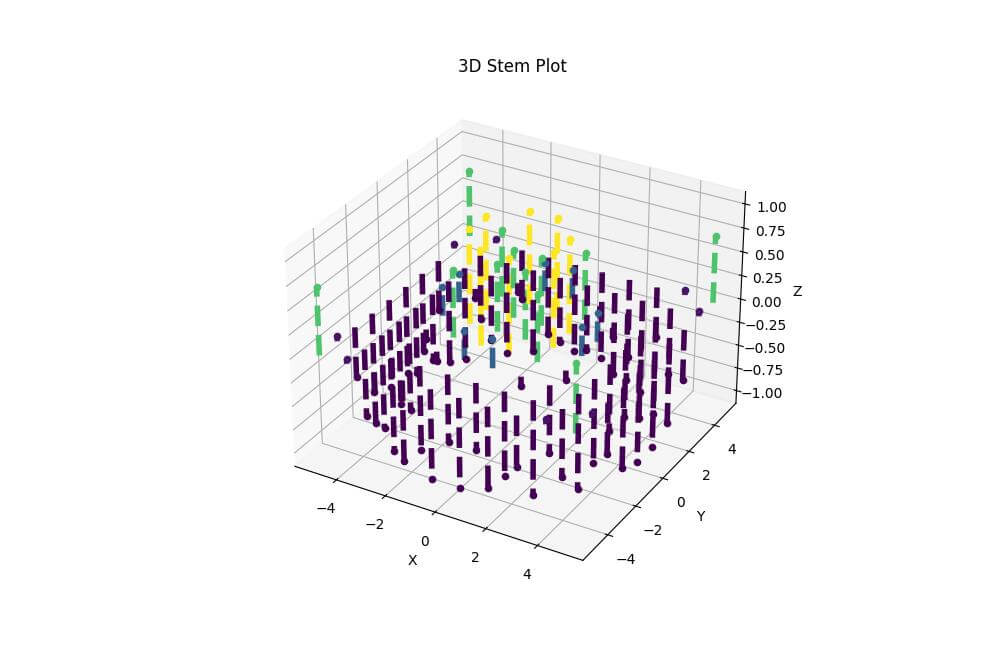
This code creates red, dashed stems with increased line width.
Change Marker Size and Shape
You can modify the markers at the top of each stem using the marker and markersize parameters:
def stem3D(ax, x, y, z, **kwargs):
    marker_style = kwargs.pop('marker', 'o')
    marker_size = kwargs.pop('markersize', 20)
    for xi, yi, zi in zip(x, y, z):
        line = ax.plot([xi, xi], [yi, yi], [0, zi], **kwargs)
        ax.scatter(xi, yi, zi, c=line[0].get_color(), marker=marker_style, s=marker_size)
stem3D(ax, x_stem, y_stem, z_stem, linewidth=1, color='g', marker='^', markersize=50)
plt.show()
Output:
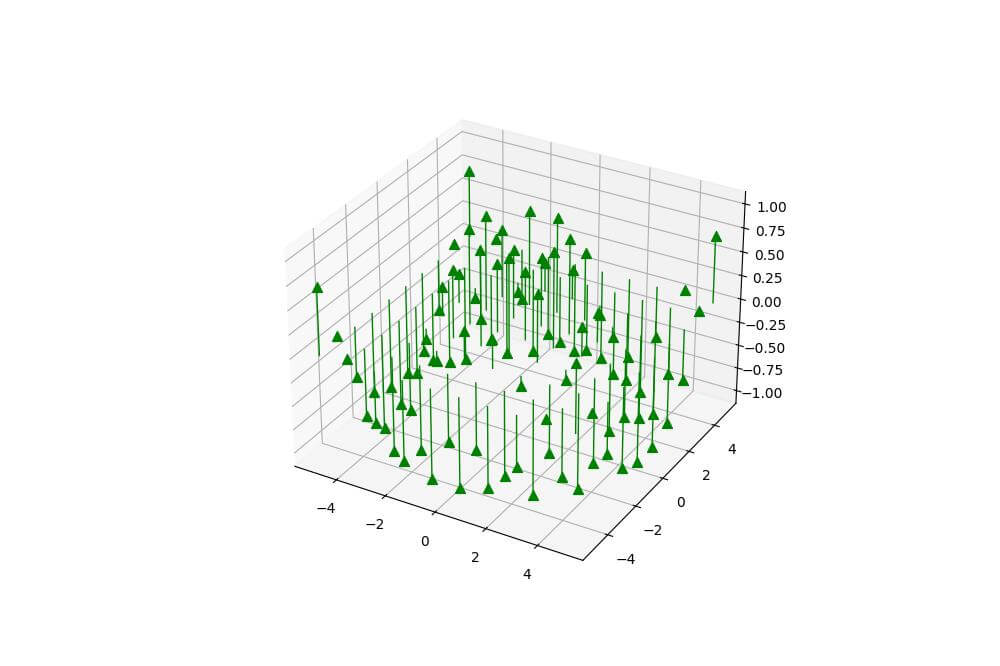
This code creates green stems with large triangular markers at the top.
Mokhtar is the founder of LikeGeeks.com. He is a seasoned technologist and accomplished author, with expertise in Linux system administration and Python development. Since 2010, Mokhtar has built an impressive career, transitioning from system administration to Python development in 2015. His work spans large corporations to freelance clients around the globe. Alongside his technical work, Mokhtar has authored some insightful books in his field. Known for his innovative solutions, meticulous attention to detail, and high-quality work, Mokhtar continually seeks new challenges within the dynamic field of technology.