Create 3D Network Graph in Python using Plotly
Network graphs allow you to visualize complex relationships between entities.
In this tutorial, you’ll learn how to create 3D network graphs using Plotly in Python.
You’ll explore various methods to customize your 3D network graph, including layout algorithms, node and edge styling, animations, and more.
Data Preparation
To begin, you’ll need to define your nodes and edges. Here’s an example using a small social network dataset:
import networkx as nx
import plotly.graph_objects as go
import random
nodes = ['Alice', 'Bob', 'Charlie', 'David', 'Eve']
edges = [('Alice', 'Bob'), ('Bob', 'Charlie'), ('Charlie', 'David'), ('David', 'Eve'), ('Eve', 'Alice')]
G = nx.Graph()
G.add_nodes_from(nodes)
G.add_edges_from(edges)
print(f"Number of nodes: {G.number_of_nodes()}")
print(f"Number of edges: {G.number_of_edges()}")
Output:
Number of nodes: 5
Number of edges: 5
This code creates a simple graph with 5 nodes and 5 edges which simulates a circular social network.
You can assign various attributes to nodes to enhance your visualization:
# Assign random 3D positions to nodes
pos = {node: (random.uniform(-1, 1), random.uniform(-1, 1), random.uniform(-1, 1)) for node in G.nodes()}

# Assign random colors and sizes to nodes
node_colors = {node: f'rgb({random.randint(0, 255)}, {random.randint(0, 255)}, {random.randint(0, 255)})' for node in G.nodes()}
node_sizes = {node: random.uniform(10, 30) for node in G.nodes()}
nx.set_node_attributes(G, pos, 'pos')
nx.set_node_attributes(G, node_colors, 'color')
nx.set_node_attributes(G, node_sizes, 'size')

# Create a 3D scatter plot
node_trace = go.Scatter3d(
    x=[pos[node][0] for node in G.nodes()],
    y=[pos[node][1] for node in G.nodes()],
    z=[pos[node][2] for node in G.nodes()],
    mode='markers',
    marker=dict(
        size=[G.nodes[node]['size'] for node in G.nodes()],
        color=[G.nodes[node]['color'] for node in G.nodes()],
        line=dict(width=2, color='rgb(50, 50, 50)')
    ),
    text=list(G.nodes()),
    hoverinfo='text'
)
layout = go.Layout(
    title='3D Network Graph with Node Attributes',
    scene=dict(
        xaxis=dict(title='X'),
        yaxis=dict(title='Y'),
        zaxis=dict(title='Z')
    )
)
fig = go.Figure(data=[node_trace], layout=layout)
fig.show()
Output:
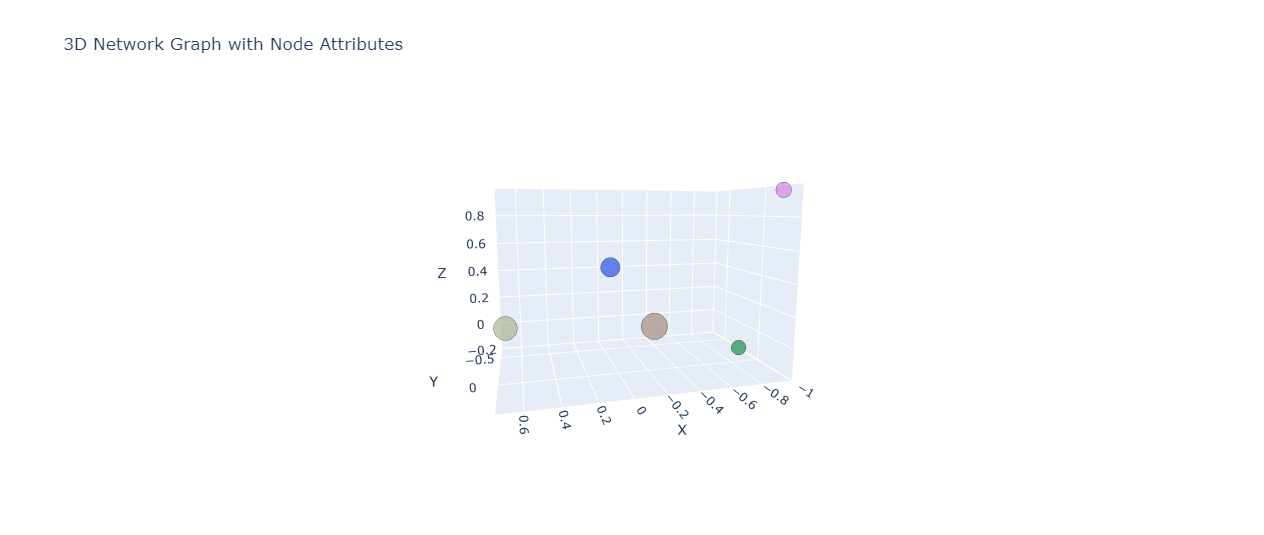
This code assigns random 3D positions, colors, and sizes to each node in the graph and creates a 3D scatter plot to visualize the nodes.
Assign Edge Attributes (weight, color)
Similarly, you can assign attributes to edges:
# Assign random weights and colors to edges
edge_weights = {edge: random.uniform(1, 5) for edge in G.edges()}
edge_colors = {edge: f'rgb({random.randint(0, 255)}, {random.randint(0, 255)}, {random.randint(0, 255)})' for edge in G.edges()}
nx.set_edge_attributes(G, edge_weights, 'weight')
nx.set_edge_attributes(G, edge_colors, 'color')

# Create edge traces
edge_traces = []
for edge in G.edges():
    x0, y0, z0 = G.nodes[edge[0]]['pos']
    x1, y1, z1 = G.nodes[edge[1]]['pos']
    edge_trace = go.Scatter3d(
        x=[x0, x1], y=[y0, y1], z=[z0, z1],
        mode='lines',
        line=dict(color=G.edges[edge]['color'], width=G.edges[edge]['weight']),
        hoverinfo='none'
    )
    edge_traces.append(edge_trace)

# Combine node and edge traces
data = [node_trace] + edge_traces
layout = go.Layout(
    title='3D Network Graph with Node and Edge Attributes',
    scene=dict(
        xaxis=dict(title='X'),
        yaxis=dict(title='Y'),
        zaxis=dict(title='Z')
    )
)
fig = go.Figure(data=data, layout=layout)
fig.show()
Output:
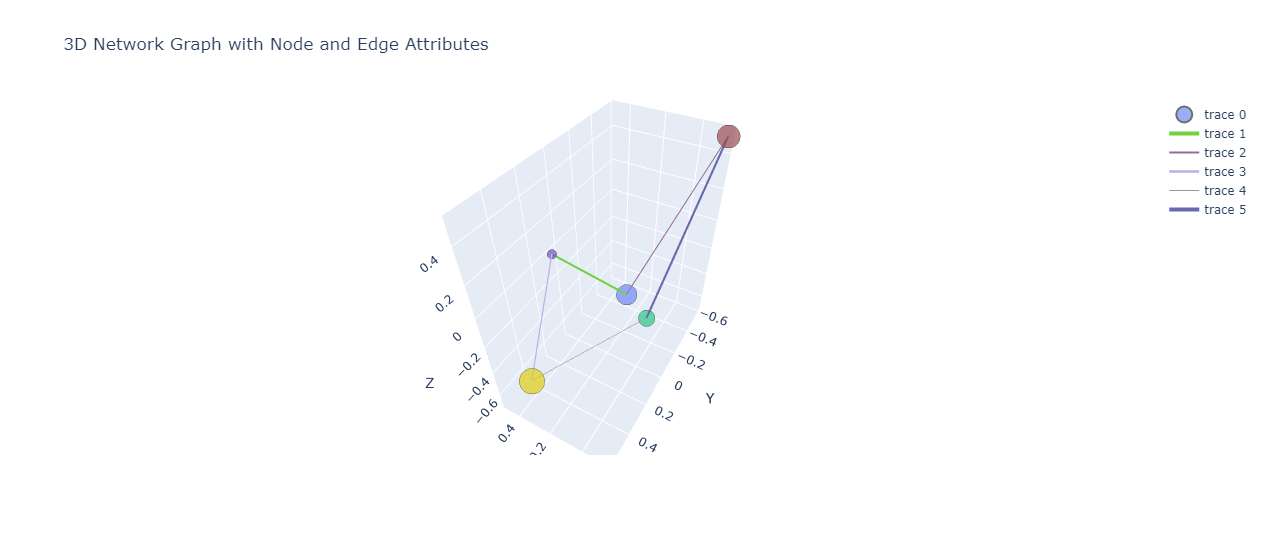
This code assigns random weights and colors to each edge in the graph and creates a 3D network graph visualization with both nodes and edges.
Layout Algorithms for 3D Graphs
Force-directed Layout
Force-directed layouts are popular for creating aesthetically pleasing graph layouts.
Here’s how to implement a simple force-directed layout in 3D:
import numpy as np
def force_directed_layout_3d(G, iterations=50):
    pos = nx.get_node_attributes(G, 'pos')
    for _ in range(iterations):
        for node in G.nodes():
            force = np.zeros(3)
            for neighbor in G.neighbors(node):
                diff = np.array(pos[node]) - np.array(pos[neighbor])
                force += 0.01 * diff / np.linalg.norm(diff)
            for other in G.nodes():
                if other != node:
                    diff = np.array(pos[node]) - np.array(pos[other])
                    force -= 0.001 * diff / (np.linalg.norm(diff) ** 2)
            pos[node] = tuple(np.array(pos[node]) + force)
    return pos
new_pos = force_directed_layout_3d(G)
nx.set_node_attributes(G, new_pos, 'pos')

# Create node trace
node_trace = go.Scatter3d(
    x=[pos[0] for pos in new_pos.values()],
    y=[pos[1] for pos in new_pos.values()],
    z=[pos[2] for pos in new_pos.values()],
    mode='markers',
    marker=dict(
        size=[G.nodes[node]['size'] for node in G.nodes()],
        color=[G.nodes[node]['color'] for node in G.nodes()],
        line=dict(width=2, color='rgb(50, 50, 50)')
    ),
    text=list(G.nodes()),
    hoverinfo='text'
)

# Create edge traces
edge_traces = []
for edge in G.edges():
    x0, y0, z0 = new_pos[edge[0]]
    x1, y1, z1 = new_pos[edge[1]]
    edge_trace = go.Scatter3d(
        x=[x0, x1], y=[y0, y1], z=[z0, z1],
        mode='lines',
        hoverinfo='none'
    )
    edge_traces.append(edge_trace)

# Combine node and edge traces
data = [node_trace] + edge_traces
layout = go.Layout(
    title='3D Network Graph with Force-Directed Layout',
    scene=dict(
        xaxis=dict(title='X'),
        yaxis=dict(title='Y'),
        zaxis=dict(title='Z')
    )
)
fig = go.Figure(data=data, layout=layout)
fig.show()
Output:
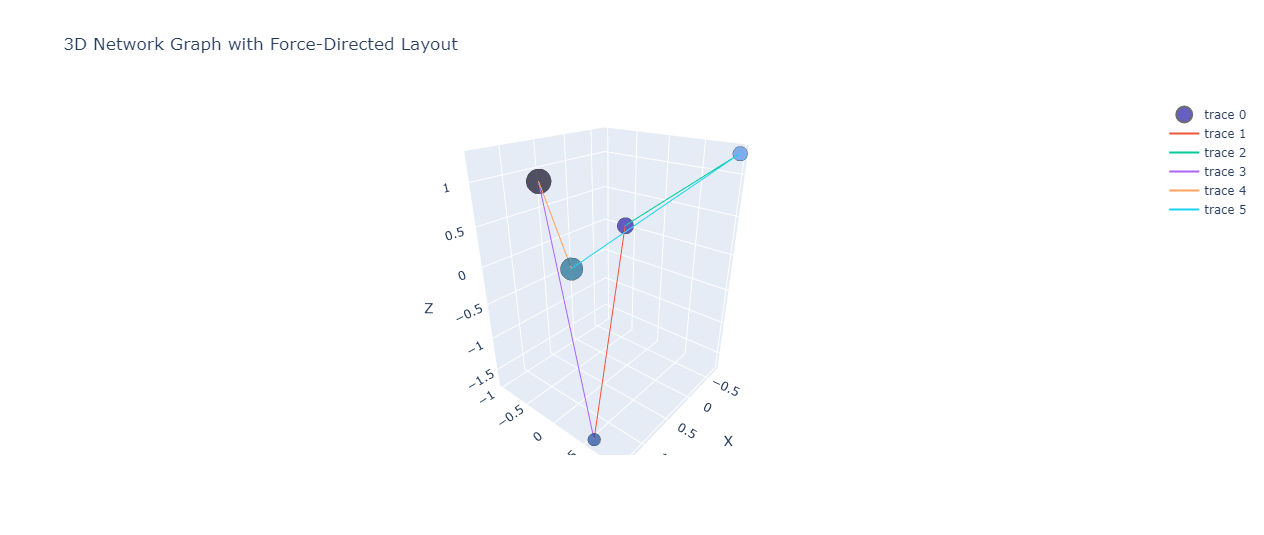
This function implements a basic force-directed layout algorithm for 3D graphs and visualizes the result.
Circular Layout
You can create a circular layout in 3D by placing nodes on a circle in the XY plane and using the Z-axis for additional information:
import math
def circular_layout_3d(G):
    pos = {}
    num_nodes = len(G.nodes())
    for i, node in enumerate(G.nodes()):
        angle = 2 * math.pi * i / num_nodes
        x = math.cos(angle)
        y = math.sin(angle)
        z = random.uniform(-1, 1)  # Random Z coordinate
        pos[node] = (x, y, z)
    return pos

circular_pos = circular_layout_3d(G)
nx.set_node_attributes(G, circular_pos, 'pos')

# Create node trace
node_trace = go.Scatter3d(
    x=[pos[0] for pos in circular_pos.values()],
    y=[pos[1] for pos in circular_pos.values()],
    z=[pos[2] for pos in circular_pos.values()],
    mode='markers',
    marker=dict(
        size=[G.nodes[node]['size'] for node in G.nodes()],
        color=[G.nodes[node]['color'] for node in G.nodes()],
        line=dict(width=2, color='rgb(50, 50, 50)')
    ),
    text=list(G.nodes()),
    hoverinfo='text'
)

# Create edge traces
edge_traces = []
for edge in G.edges():
    x0, y0, z0 = circular_pos[edge[0]]
    x1, y1, z1 = circular_pos[edge[1]]
    edge_trace = go.Scatter3d(
        x=[x0, x1], y=[y0, y1], z=[z0, z1],
        mode='lines',
        hoverinfo='none'
    )
    edge_traces.append(edge_trace)

# Combine node and edge traces
data = [node_trace] + edge_traces
layout = go.Layout(
    title='3D Network Graph with Circular Layout',
    scene=dict(
        xaxis=dict(title='X'),
        yaxis=dict(title='Y'),
        zaxis=dict(title='Z')
    )
)
fig = go.Figure(data=data, layout=layout)
fig.show()
Output:
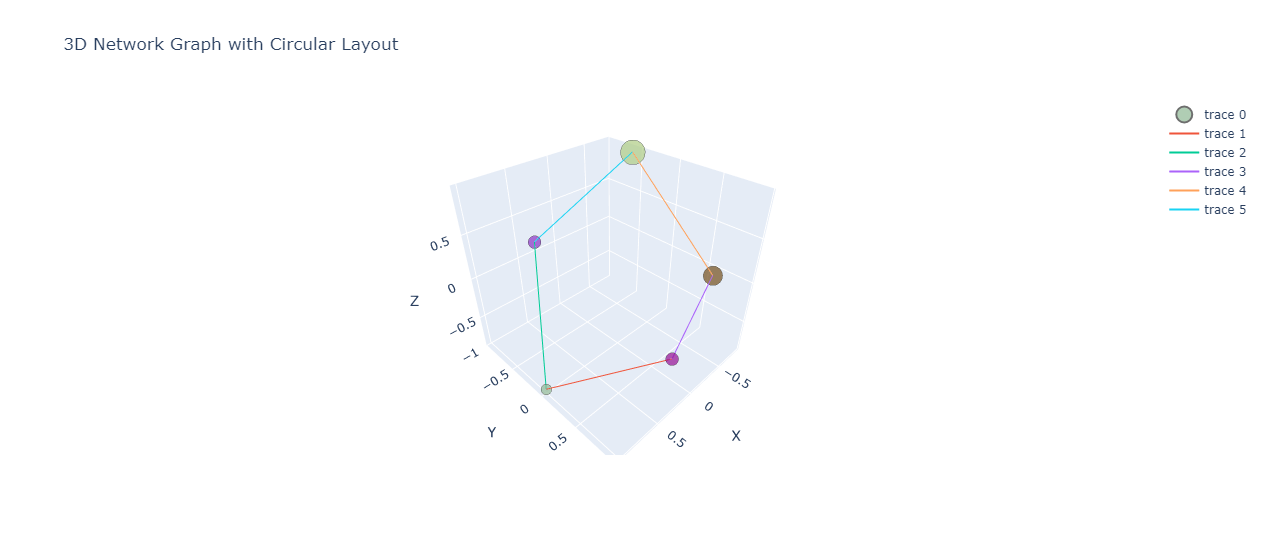
This function creates a circular layout in the XY plane while assigning random Z coordinates to add depth to the visualization.
Random layout
A random layout can be useful for certain types of graphs or as a starting point for other layout algorithms:
def random_layout_3d(G):
    return {node: (random.uniform(-1, 1), random.uniform(-1, 1), random.uniform(-1, 1)) for node in G.nodes()}

random_pos = random_layout_3d(G)
nx.set_node_attributes(G, random_pos, 'pos')

# Create node trace
node_trace = go.Scatter3d(
    x=[pos[0] for pos in random_pos.values()],
    y=[pos[1] for pos in random_pos.values()],
    z=[pos[2] for pos in random_pos.values()],
    mode='markers',
    marker=dict(
        size=[G.nodes[node]['size'] for node in G.nodes()],
        color=[G.nodes[node]['color'] for node in G.nodes()],
        line=dict(width=2, color='rgb(50, 50, 50)')
    ),
    text=list(G.nodes()),
    hoverinfo='text'
)

# Create edge traces
edge_traces = []
for edge in G.edges():
    x0, y0, z0 = random_pos[edge[0]]
    x1, y1, z1 = random_pos[edge[1]]
    edge_trace = go.Scatter3d(
        x=[x0, x1], y=[y0, y1], z=[z0, z1],
        mode='lines',
        hoverinfo='none'
    )
    edge_traces.append(edge_trace)

# Combine node and edge traces
data = [node_trace] + edge_traces
layout = go.Layout(
    title='3D Network Graph with Random Layout',
    scene=dict(
        xaxis=dict(title='X'),
        yaxis=dict(title='Y'),
        zaxis=dict(title='Z')
    )
)
fig = go.Figure(data=data, layout=layout)
fig.show()
Output:
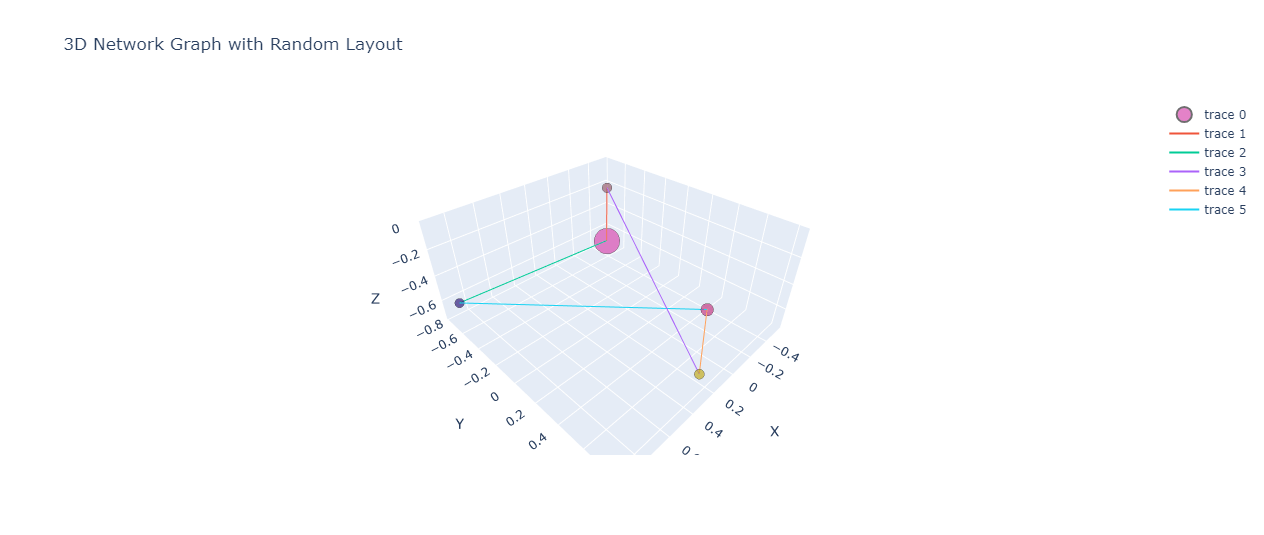
This function generates a completely random layout in 3D space and visualizes it.
Custom Layout methods
You can create custom layout methods based on your specific requirements.
For example, you might want to position nodes based on certain attributes or external data:
def custom_layout_3d(G):
    pos = {}
    for node in G.nodes():
        # Example: position nodes based on their degree
        degree = G.degree(node)
        x = degree * random.uniform(-1, 1)
        y = degree * random.uniform(-1, 1)
        z = degree * random.uniform(-1, 1)
        pos[node] = (x, y, z)
    return pos
custom_pos = custom_layout_3d(G)
nx.set_node_attributes(G, custom_pos, 'pos')

# Create node trace
node_trace = go.Scatter3d(
    x=[pos[0] for pos in custom_pos.values()],
    y=[pos[1] for pos in custom_pos.values()],
    z=[pos[2] for pos in custom_pos.values()],
    mode='markers',
    marker=dict(
        size=[G.nodes[node]['size'] for node in G.nodes()],
        color=[G.nodes[node]['color'] for node in G.nodes()],
        line=dict(width=2, color='rgb(50, 50, 50)')
    ),
    text=list(G.nodes()),
    hoverinfo='text'
)

# Create edge traces
edge_traces = []
for edge in G.edges():
    x0, y0, z0 = custom_pos[edge[0]]
    x1, y1, z1 = custom_pos[edge[1]]
    edge_trace = go.Scatter3d(
        x=[x0, x1], y=[y0, y1], z=[z0, z1],
        mode='lines',
        line=dict(color=G.edges[edge]['color'], width=G.edges[edge]['weight']),
        hoverinfo='none'
    )
    edge_traces.append(edge_trace)

# Combine node and edge traces
data = [node_trace] + edge_traces
layout = go.Layout(
    title='3D Network Graph with Custom Layout',
    scene=dict(
        xaxis=dict(title='X'),
        yaxis=dict(title='Y'),
        zaxis=dict(title='Z')
    )
)
fig = go.Figure(data=data, layout=layout)
fig.show()
Output:
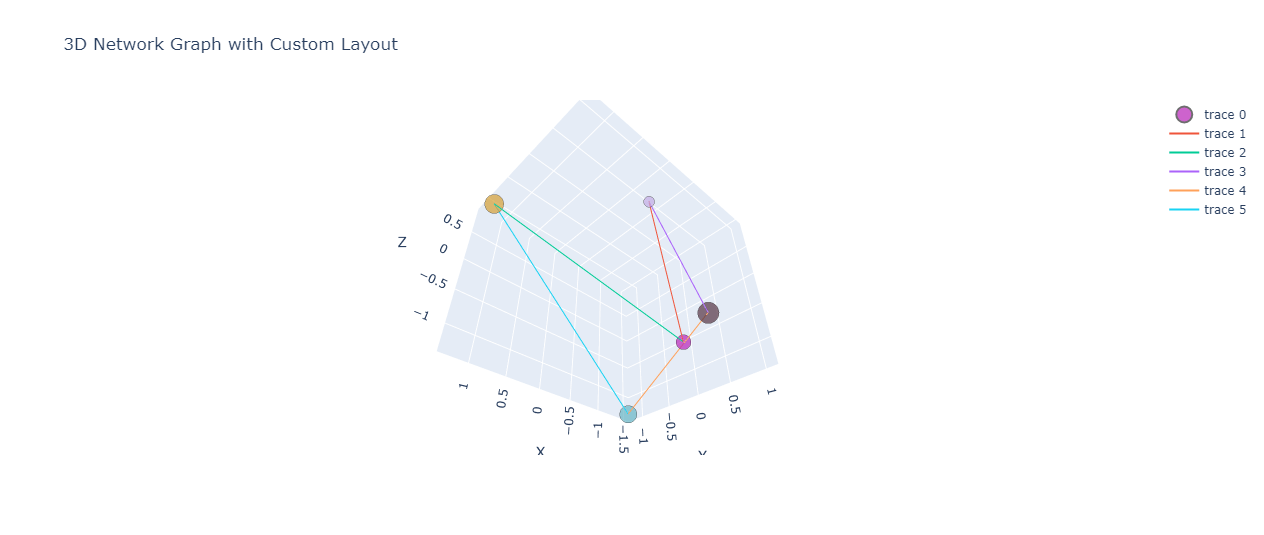
This custom layout method positions nodes based on their degree, with higher-degree nodes potentially occupying a larger space in the 3D visualization.
Customize Node Appearance
Adjust node sizes
You can adjust node sizes based on various criteria:
def set_node_sizes(G):
  sizes = []
  for node in G.nodes():
      # Example: size nodes based on their betweenness centrality
      betweenness = nx.betweenness_centrality(G)[node]
      sizes.append(20 + 100 * betweenness)  # Scale the size
  return sizes
node_sizes = set_node_sizes(G)

# Create a 3D scatter plot for nodes
node_trace = go.Scatter3d(
  x=[pos[node][0] for node in G.nodes()],
  y=[pos[node][1] for node in G.nodes()],
  z=[pos[node][2] for node in G.nodes()],
  mode='markers',
  marker=dict(
      size=node_sizes,
      color='rgb(0, 0, 255)',
      line=dict(width=2, color='rgb(50, 50, 50)')
  ),
  text=list(G.nodes()),
  hoverinfo='text'
)
edge_traces = []
for edge in G.edges():
  x0, y0, z0 = pos[edge[0]]
  x1, y1, z1 = pos[edge[1]]
  edge_trace = go.Scatter3d(
      x=[x0, x1], y=[y0, y1], z=[z0, z1],
      mode='lines',
      line=dict(color='rgb(50, 50, 50)', width=2),
      hoverinfo='none'
  )
  edge_traces.append(edge_trace)
data = [node_trace] + edge_traces
layout = go.Layout(
  title='3D Network Graph with Custom Node Sizes',
  scene=dict(
      xaxis=dict(title='X'),
      yaxis=dict(title='Y'),
      zaxis=dict(title='Z')
  )
)
fig = go.Figure(data=data, layout=layout)
fig.show()
Output:
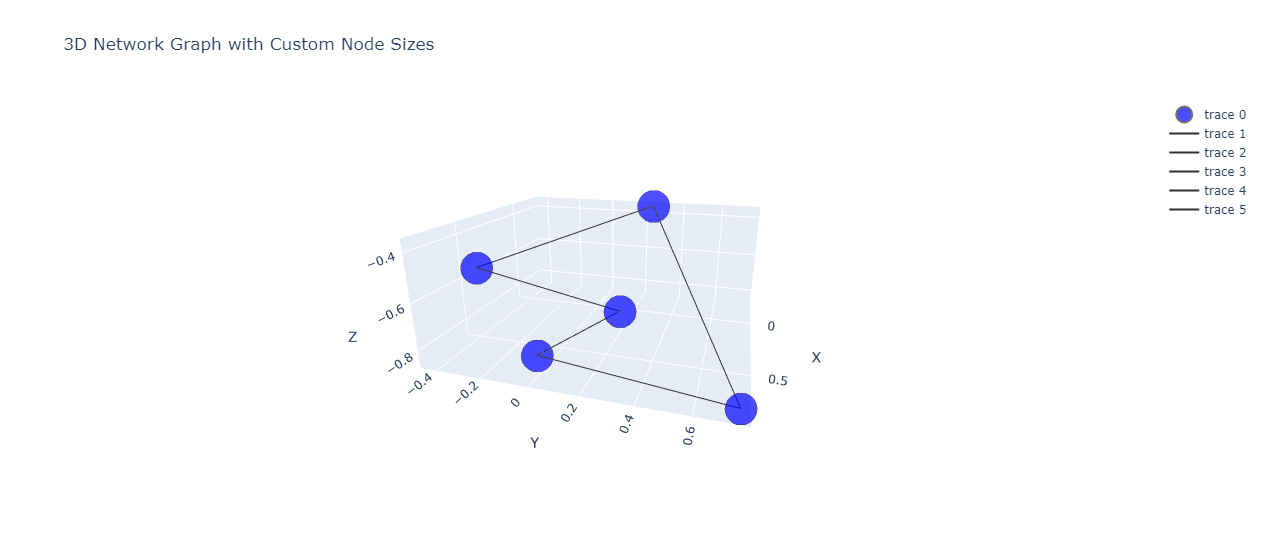
This code adjusts node sizes based on their betweenness centrality.
Add Node Labels
You can add labels to nodes for better identification:
node_trace = go.Scatter3d(
x=[pos[node][0] for node in G.nodes()],
y=[pos[node][1] for node in G.nodes()],
z=[pos[node][2] for node in G.nodes()],
mode='markers+text', # Add 'text' to the mode
marker=dict(
color=node_colors,
line=dict(width=2, color='rgb(50, 50, 50)')
),
text=list(G.nodes()),
hoverinfo='text',
textposition='top center', # Position the label above the node
textfont=dict(size=10, color='rgb(0, 0, 0)') # Customize text font
)
edge_traces = []
for edge in G.edges():
x0, y0, z0 = pos[edge[0]]
x1, y1, z1 = pos[edge[1]]
edge_trace = go.Scatter3d(
x=[x0, x1], y=[y0, y1], z=[z0, z1],
mode='lines',
line=dict(color='rgb(50, 50, 50)', width=2),
hoverinfo='none'
)
edge_traces.append(edge_trace)
data = [node_trace] + edge_traces
layout = go.Layout(
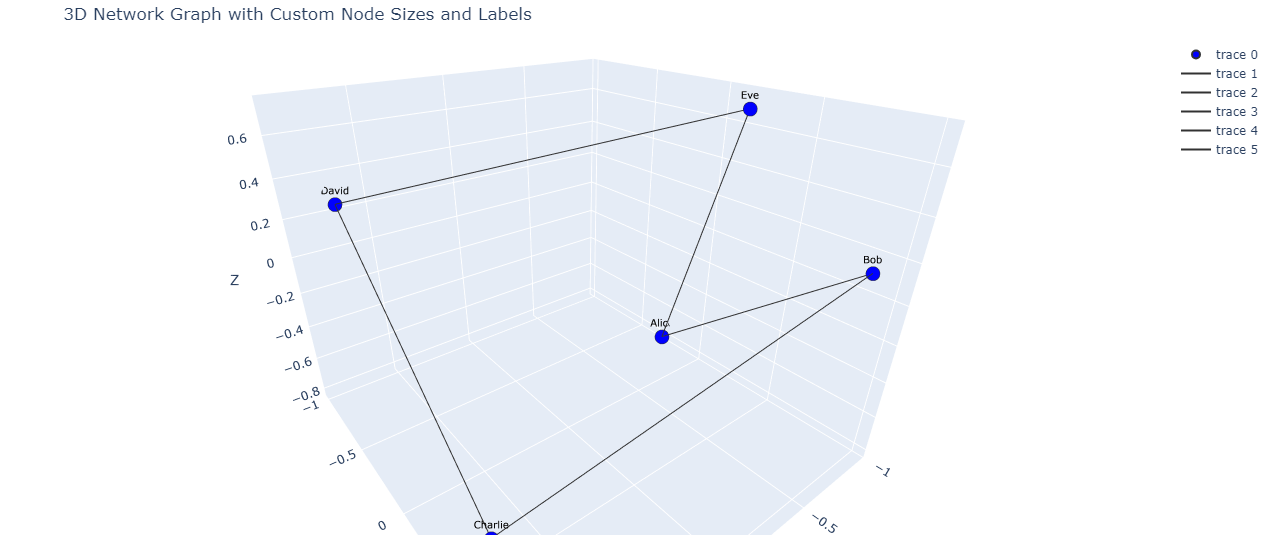
title='3D Network Graph with Custom Node Sizes and Labels',
scene=dict(
xaxis=dict(title='X'),
yaxis=dict(title='Y'),
zaxis=dict(title='Z'),
camera=dict(eye=dict(x=1.5, y=1.5, z=1.5)), # Adjust camera view
),
margin=dict(l=0, r=0, b=0, t=40) # Adjust margins
)
fig = go.Figure(data=data, layout=layout)
fig.show()
Output:
Animate Network Graph
To animate changes in the graph over time, you can use Plotly frame-based animation:
import plotly.graph_objects as go
graph_states = []
for i in range(5):
  G_copy = G.copy()
  # Modify the graph (e.g., add/remove nodes or edges)
  new_node = f'New_Node_{i}'
  G_copy.add_node(new_node)
  # Assign a random position to the new node
  G_copy.nodes[new_node]['pos'] = (random.uniform(-1, 1), random.uniform(-1, 1), random.uniform(-1, 1))
  G_copy.add_edge(random.choice(list(G_copy.nodes())), new_node)
  graph_states.append(G_copy)

# Create frames for animation
frames = []
for i, G_state in enumerate(graph_states):
  node_trace = go.Scatter3d(
      x=[G_state.nodes[node]['pos'][0] for node in G_state.nodes()],
      y=[G_state.nodes[node]['pos'][1] for node in G_state.nodes()],
      z=[G_state.nodes[node]['pos'][2] for node in G_state.nodes()],
      mode='markers',
      marker=dict(size=10, color='blue'),
      text=list(G_state.nodes()),
      hoverinfo='text'
  )
  edge_traces = []
  for edge in G_state.edges():
      x0, y0, z0 = G_state.nodes[edge[0]]['pos']
      x1, y1, z1 = G_state.nodes[edge[1]]['pos']
      edge_trace = go.Scatter3d(
          x=[x0, x1], y=[y0, y1], z=[z0, z1],
          mode='lines',
          line=dict(color='red', width=2),
          hoverinfo='none'
      )
      edge_traces.append(edge_trace)
  frame = go.Frame(data=[node_trace] + edge_traces, name=f'frame{i}')
  frames.append(frame)
fig = go.Figure(
  data=frames[0].data,
  layout=go.Layout(
      title='Animated 3D Network Graph',
      updatemenus=[dict(type='buttons', showactive=False, buttons=[dict(label='Play', method='animate', args=[None])])],
      scene=dict(
          xaxis=dict(title='X'),
          yaxis=dict(title='Y'),
          zaxis=dict(title='Z')
      )
  ),
  frames=frames
)
fig.show()
Output:
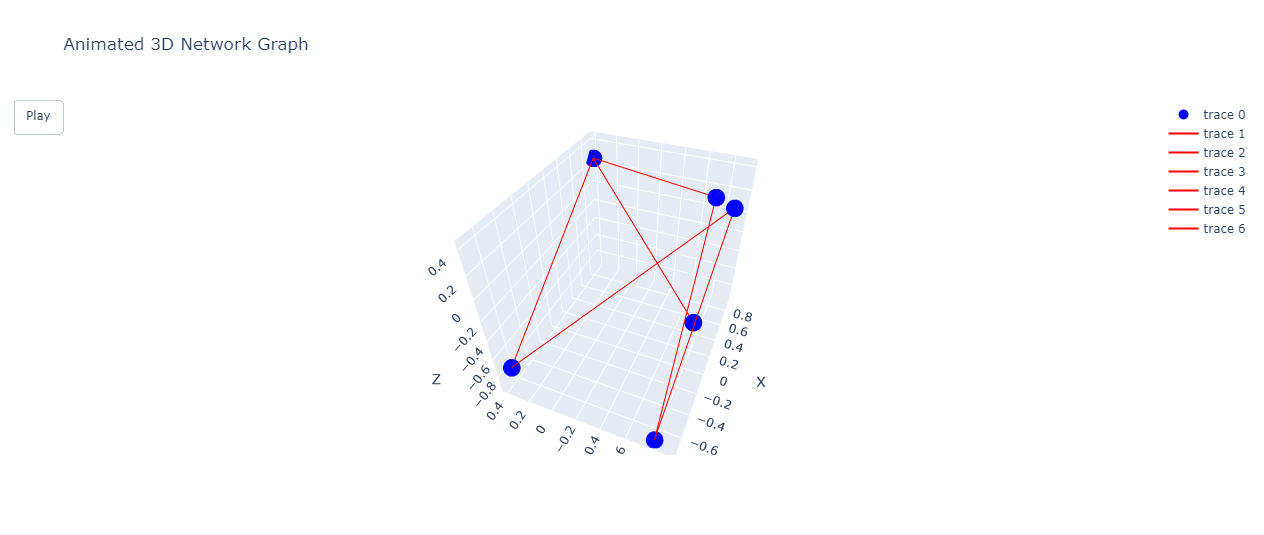
This code creates an animated 3D network graph that shows changes in the graph structure after clicking the play button.
Mokhtar is the founder of LikeGeeks.com. He is a seasoned technologist and accomplished author, with expertise in Linux system administration and Python development. Since 2010, Mokhtar has built an impressive career, transitioning from system administration to Python development in 2015. His work spans large corporations to freelance clients around the globe. Alongside his technical work, Mokhtar has authored some insightful books in his field. Known for his innovative solutions, meticulous attention to detail, and high-quality work, Mokhtar continually seeks new challenges within the dynamic field of technology.