Create 3D Network Graph in Python using Matplotlib
In this tutorial, you’ll learn how to create 3D network graphs using Python and Matplotlib.
You’ll discover how to draw nodes and edges, add arrows to show edge directions, and more.
Data Preparation
To start, you need to define your nodes and edges. Here’s how you can create simple data structures:
import numpy as np
nodes = ['Amun', 'Bastet', 'Cleopatra', 'Djoser', 'Esna']
adj_matrix = np.array([
    [0, 1, 1, 0, 1],
    [1, 0, 1, 1, 0],
    [1, 1, 0, 1, 1],
    [0, 1, 1, 0, 1],
    [1, 0, 1, 1, 0]
])
print("Nodes:", nodes)
print("Adjacency Matrix:\n", adj_matrix)
Output:
Nodes: ['Amun', 'Bastet', 'Cleopatra', 'Djoser', 'Esna']
Adjacency Matrix:
 [[0 1 1 0 1]
 [1 0 1 1 0]
 [1 1 0 1 1]
 [0 1 1 0 1]
 [1 0 1 1 0]]
This code defines a list of nodes and an adjacency matrix representing connections between them.
The adjacency matrix is a square matrix where a 1 indicates a connection between nodes, and 0 indicates no connection.
Now, you’ll assign 3D coordinates to each node:
import numpy as np
node_positions = np.random.rand(len(nodes), 3)
print("Node positions:")
for node, pos in zip(nodes, node_positions):
    print(f"{node}: {pos}")
Output:
Node positions:
Amun: [0.03053411 0.59253676 0.45139896]
Bastet: [0.52378609 0.20916904 0.9218721 ]
Cleopatra: [0.25040101 0.58339799 0.61999518]
Djoser: [0.9006618  0.08841267 0.25159064]
Esna: [1.77263170e-04 7.99899935e-01 7.34922324e-01]
This code generates random 3D coordinates for each node.
In real-world cases, these positions might be determined by specific data attributes or layout algorithms.
You can extract edge connections from the adjacency matrix:
edges = []
for i in range(len(nodes)):
    for j in range(i+1, len(nodes)):
        if adj_matrix[i][j] == 1:
            edges.append((nodes[i], nodes[j]))
print("Edges:", edges)
Output:
Edges: [('Amun', 'Bastet'), ('Amun', 'Cleopatra'), ('Amun', 'Esna'), ('Bastet', 'Cleopatra'), ('Bastet', 'Djoser'), ('Cleopatra', 'Djoser'), ('Cleopatra', 'Esna'), ('Djoser', 'Esna')]
This code creates a list of edges by iterating through the adjacency matrix and identifying connections between nodes.
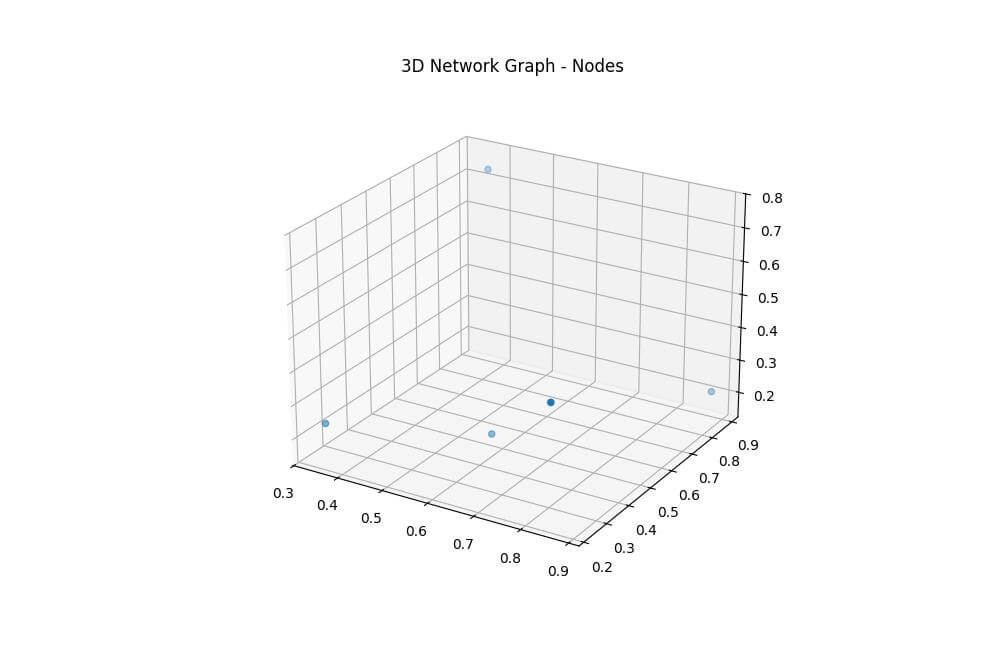
Draw Nodes
To visualize nodes in 3D space, you’ll use Matplotlib’s scatter function:
import matplotlib.pyplot as plt
from mpl_toolkits.mplot3d import Axes3D
fig = plt.figure(figsize=(10, 8))
ax = fig.add_subplot(111, projection='3d')
x, y, z = node_positions.T
ax.scatter(x, y, z)
plt.title("3D Network Graph - Nodes")
plt.show()
Output:
Customize Node Appearance (size, color, shape)
You can enhance the visual appeal of your nodes by customizing their appearance:
import matplotlib.pyplot as plt
from mpl_toolkits.mplot3d import Axes3D
fig = plt.figure(figsize=(10, 8))
ax = fig.add_subplot(111, projection='3d')
x, y, z = node_positions.T
ax.scatter(x, y, z, s=100, c='skyblue', edgecolors='navy', marker='o')
plt.title("3D Network Graph - Customized Nodes")
plt.show()
Output:
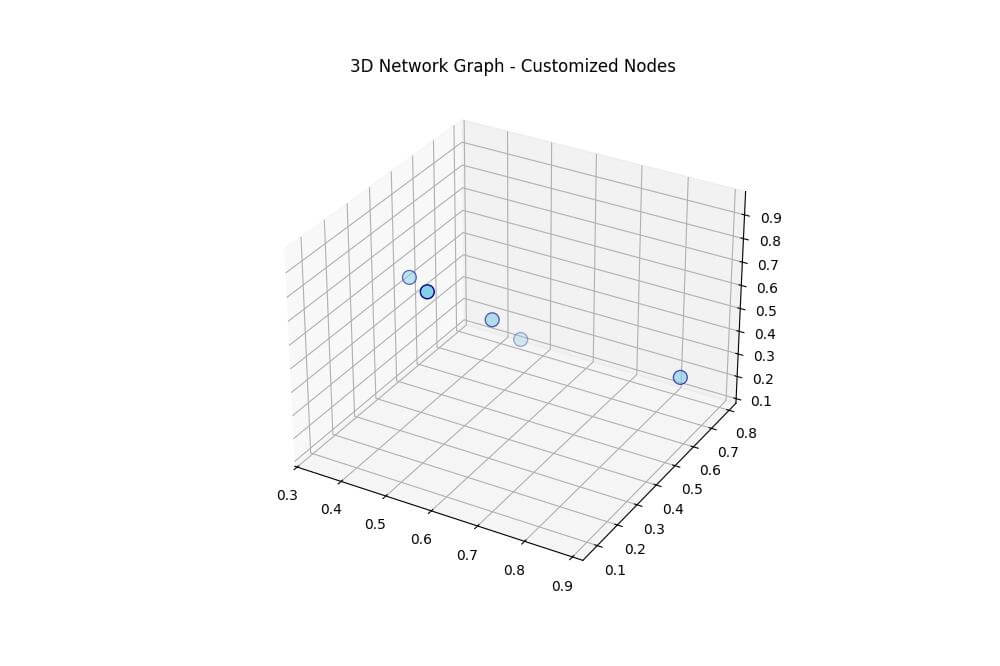
This code makes the size of the nodes larger, the color light blue, and the shape circular.
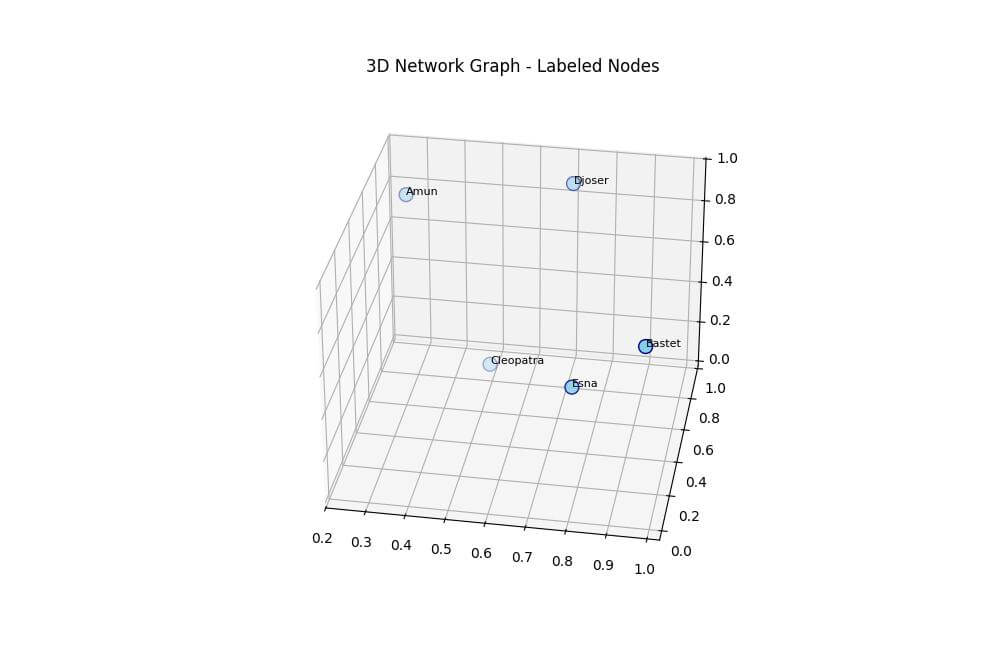
Add Node Labels
To make your graph more informative, you can add labels to the nodes:
import matplotlib.pyplot as plt
from mpl_toolkits.mplot3d import Axes3D
fig = plt.figure(figsize=(10, 8))
ax = fig.add_subplot(111, projection='3d')
x, y, z = node_positions.T
ax.scatter(x, y, z, s=100, c='skyblue', edgecolors='navy', marker='o')
for i, node in enumerate(nodes):
    ax.text(x[i], y[i], z[i], node, fontsize=8)
plt.title("3D Network Graph - Labeled Nodes")
plt.show()
Output:
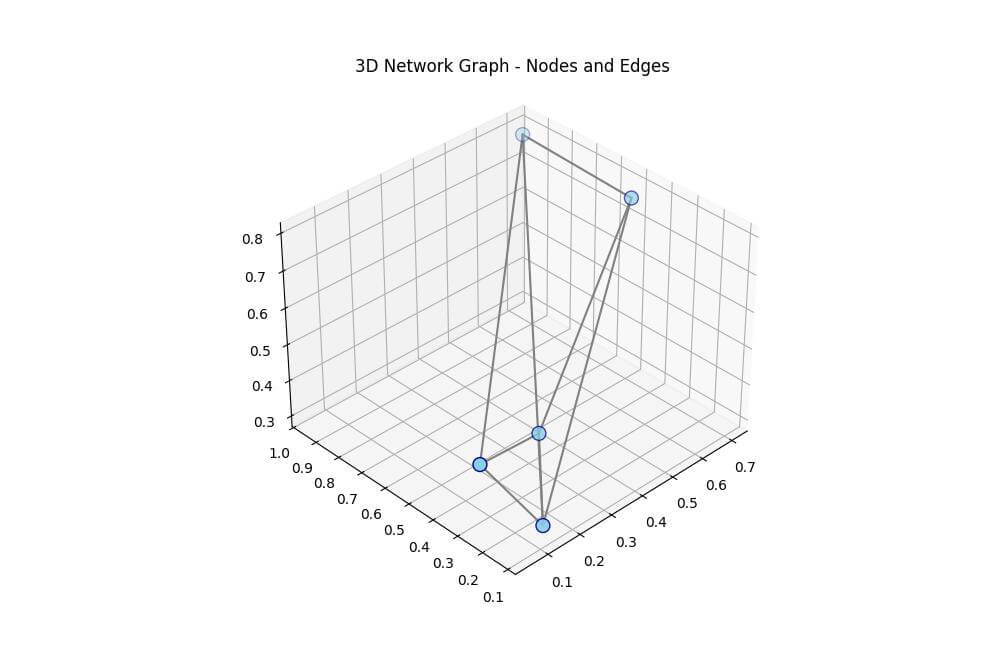
Draw Edges
To draw edges between nodes, you’ll use the plot3D function:
import matplotlib.pyplot as plt
from mpl_toolkits.mplot3d import Axes3D
fig = plt.figure(figsize=(10, 8))
ax = fig.add_subplot(111, projection='3d')
x, y, z = node_positions.T
ax.scatter(x, y, z, s=100, c='skyblue', edgecolors='navy', marker='o')
for edge in edges:
    start = node_positions[nodes.index(edge[0])]
    end = node_positions[nodes.index(edge[1])]
    ax.plot3D(*zip(start, end), color='gray')
plt.title("3D Network Graph - Nodes and Edges")
plt.show()
Output:
Edge Weights and Line Styles
You can represent edge weights by varying line thickness:
import matplotlib.pyplot as plt
from mpl_toolkits.mplot3d import Axes3D
import numpy as np
fig = plt.figure(figsize=(10, 8))
ax = fig.add_subplot(111, projection='3d')

# Draw nodes
x, y, z = node_positions.T
ax.scatter(x, y, z, s=100, c='skyblue', edgecolors='navy', marker='o')

# Draw weighted edges
for edge in edges:
    start = node_positions[nodes.index(edge[0])]
    end = node_positions[nodes.index(edge[1])]
    weight = np.random.rand()  # Random weight for demonstration
    ax.plot3D(*zip(start, end), color='gray', linewidth=weight*5)
plt.title("3D Network Graph - Weighted Edges")
plt.show()
Output:
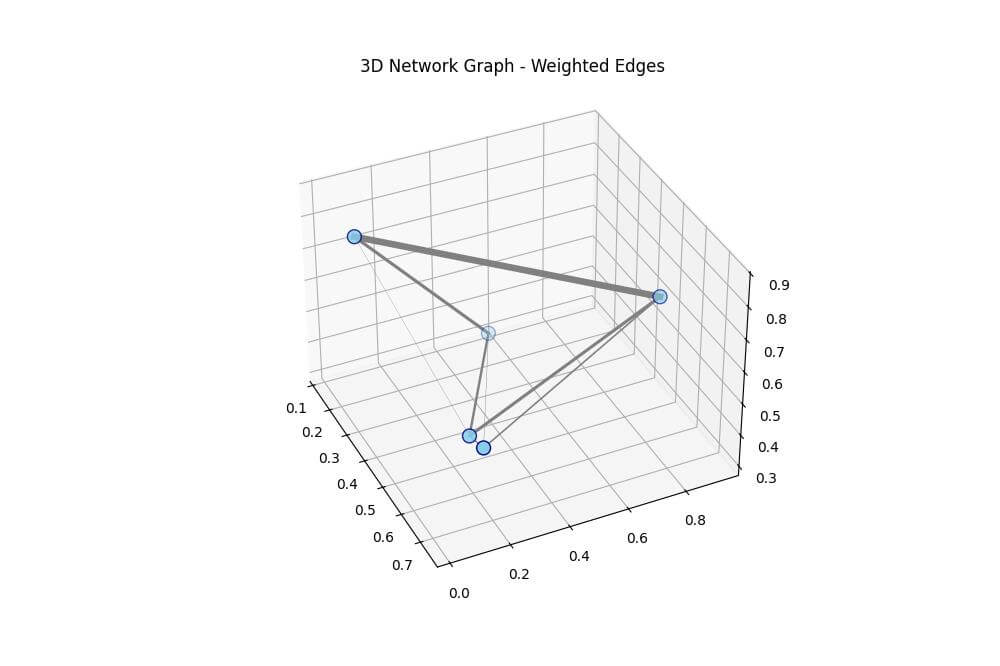
This code assigns random weights to edges and adjusts line thickness accordingly.
Arrow Directions for Directed Graphs
For directed graphs, you can add arrows to show edge directions:
import matplotlib.pyplot as plt
from mpl_toolkits.mplot3d import Axes3D
fig = plt.figure(figsize=(10, 8))
ax = fig.add_subplot(111, projection='3d')
x, y, z = node_positions.T
ax.scatter(x, y, z, s=100, c='skyblue', edgecolors='navy', marker='o')
node_radius = 0.02
for edge in edges:
  start = node_positions[nodes.index(edge[0])]
  end = node_positions[nodes.index(edge[1])]
  direction = end - start
  direction = direction / np.linalg.norm(direction)
  adjusted_start = start + direction * node_radius
  adjusted_end = end - direction * node_radius
  mid = (adjusted_start + adjusted_end) / 2
  ax.plot3D(*zip(adjusted_start, adjusted_end), color='gray')

  # Draw arrow
  arrow_vector = adjusted_end - mid
  ax.quiver(*mid, *arrow_vector, color='red', arrow_length_ratio=0.15)
plt.title("3D Network Graph - Directed Edges")
plt.show()
Output:
![]()
This code adds arrows to the middle of each edge to indicate the direction of the connection in a directed graph.
Mokhtar is the founder of LikeGeeks.com. He is a seasoned technologist and accomplished author, with expertise in Linux system administration and Python development. Since 2010, Mokhtar has built an impressive career, transitioning from system administration to Python development in 2015. His work spans large corporations to freelance clients around the globe. Alongside his technical work, Mokhtar has authored some insightful books in his field. Known for his innovative solutions, meticulous attention to detail, and high-quality work, Mokhtar continually seeks new challenges within the dynamic field of technology.