How to Create 3D Bar Plots in Python
In this tutorial, you’ll learn how to create 3D bar plots using multiple Python libraries such as Matplotlib, Plotly, and Mayavi.
Using Matplotlib
To create a 3D bar plot using Matplotlib, use the bar3d() function:
import numpy as np
import matplotlib.pyplot as plt
from mpl_toolkits.mplot3d import Axes3D
x = np.arange(5)
y = np.arange(5)
x, y = np.meshgrid(x, y)
z = np.random.randint(1, 10, size=(5, 5))
fig = plt.figure(figsize=(10, 8))
ax = fig.add_subplot(111, projection='3d')

# Plot the 3D bars
dx = dy = 0.8  # Width of each bar
dz = z.flatten()
x = x.flatten()
y = y.flatten()
ax.bar3d(x, y, np.zeros_like(dz), dx, dy, dz, shade=True)
ax.set_xlabel('X axis')
ax.set_ylabel('Y axis')
ax.set_zlabel('Z axis')
ax.set_title('3D Bar Plot')
color_map = plt.colormaps['viridis']
scatter = ax.scatter(x, y, dz, c=dz, cmap=color_map)
plt.colorbar(scatter)
plt.show()
Output:
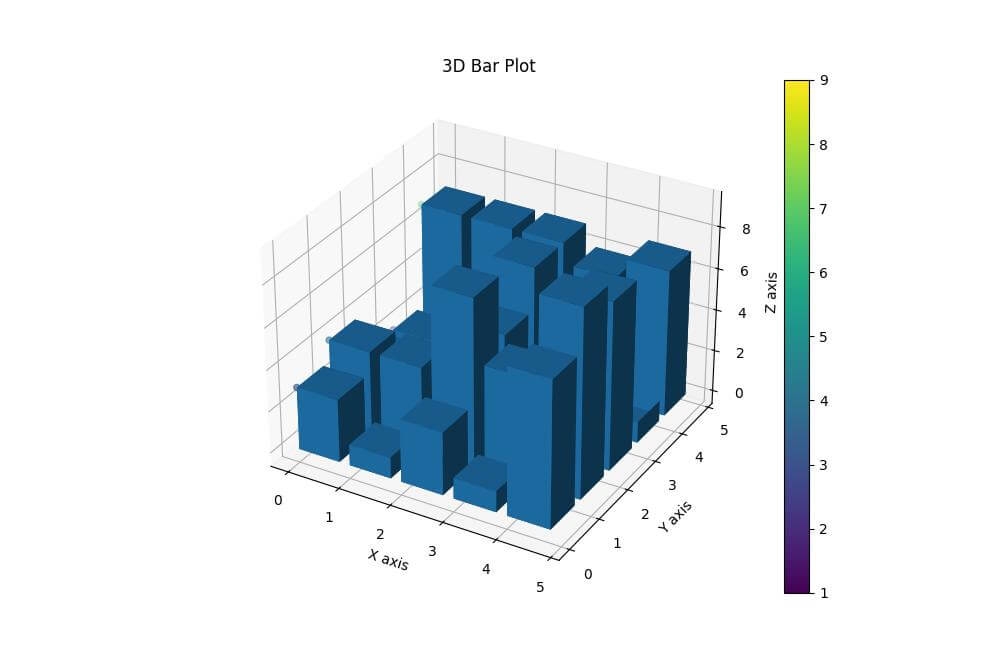
The bar3d() function is used to create the 3D bars. We flatten the x, y, and z arrays to create individual bars
Using Plotly
You can create an interactive 3D bar plot using Plotly like this:
import plotly.graph_objects as go
import numpy as np
x_data = ['A', 'B', 'C', 'D', 'E']
y_data = ['2021', '2022', '2023']
z_data = np.random.rand(len(x_data), len(y_data)) * 10
def create_3d_bar(x, y, height, width=0.8, depth=0.8):
    # Define vertices for a bar centered at (x, y) with given height
    vertices = [
        (x - width / 2, y - depth / 2, 0),
        (x + width / 2, y - depth / 2, 0),
        (x + width / 2, y + depth / 2, 0),
        (x - width / 2, y + depth / 2, 0),
        (x - width / 2, y - depth / 2, height),
        (x + width / 2, y - depth / 2, height),
        (x + width / 2, y + depth / 2, height),
        (x - width / 2, y + depth / 2, height),
    ]

    # Define the mesh for these vertices
    i = [7, 0, 0, 0, 4, 4, 6, 6, 4, 0, 3, 2]
    j = [3, 4, 1, 2, 5, 6, 5, 2, 0, 1, 6, 3]
    k = [0, 7, 2, 3, 6, 7, 1, 1, 5, 5, 7, 6]
    return go.Mesh3d(x=[p[0] for p in vertices],
                     y=[p[1] for p in vertices],
                     z=[p[2] for p in vertices],
                     i=i, j=j, k=k, color='green', opacity=0.7)
fig = go.Figure()

# Create a bar for each data point
for xi, x_val in enumerate(x_data):
    for yi, y_val in enumerate(y_data):
        fig.add_trace(create_3d_bar(xi, yi, z_data[xi, yi]))
fig.update_layout(
    title='3D Bar Plot',
    scene=dict(
        xaxis_title='X Axis',
        yaxis_title='Y Axis',
        zaxis_title='Z Axis',
        aspectmode='data'
    ),
    margin=dict(r=20, b=10, l=10, t=40),
    autosize=False,
    width=700,
    height=500,
)
fig.show()
Output:
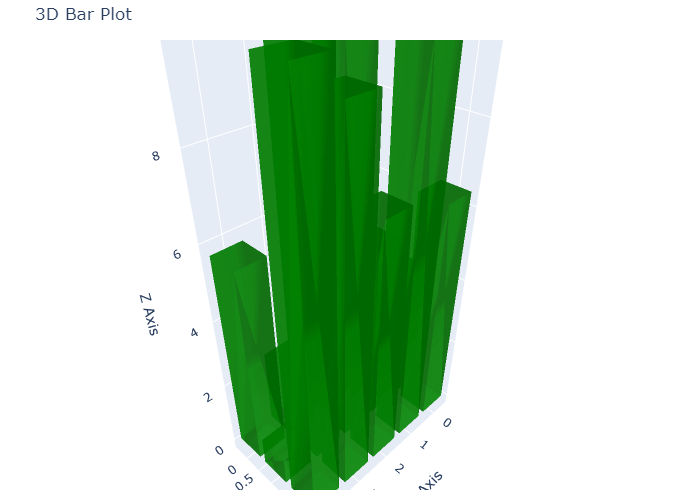
The create_3d_bar Function function defines the vertices and faces of a rectangular bar.
You can adjust width and depth to change the look of your bars.
We use Mesh3d to plot these bars. This trace object requires the vertices (x, y, z) and the faces defined by indices (i, j, k).
Using Mayavi
Mayavi is a powerful 3D visualization library that can create complex 3D plots.
To create a 3D bar plot using Mayavi, you can use the barchart() function:
from mayavi import mlab
import numpy as np
x, y = np.mgrid[0:5, 0:5]
z = np.array([[1, 2, 3, 2, 1],
              [2, 3, 4, 3, 2],
              [3, 4, 5, 4, 3],
              [2, 3, 4, 3, 2],
              [1, 2, 3, 2, 1]])
mlab.figure(bgcolor=(1, 1, 1))
mlab.barchart(x, y, z)
mlab.title("3D Bar Plot using Mayavi")
mlab.show()
Output:

The mgrid() function is used to create a mesh grid for x and y coordinates, while z represents the height of each bar.
Mokhtar is the founder of LikeGeeks.com. He is a seasoned technologist and accomplished author, with expertise in Linux system administration and Python development. Since 2010, Mokhtar has built an impressive career, transitioning from system administration to Python development in 2015. His work spans large corporations to freelance clients around the globe. Alongside his technical work, Mokhtar has authored some insightful books in his field. Known for his innovative solutions, meticulous attention to detail, and high-quality work, Mokhtar continually seeks new challenges within the dynamic field of technology.