Linux Network Commands Used In Network Troubleshooting
In this post, we will talk about Linux network commands and how to troubleshoot your network.
If you ensure that the physical network is working, the next step is to troubleshoot your network and here we come to our topic, which is Linux network commands and how to use them for troubleshooting your network.
We are going to cover the most used Linux network commands.
- 1 Check network connectivity using the ping command
- 2 Get DNS records using dig and host commands
- 3 Diagnose network latency using traceroute command
- 4 mtr command (realtime tracing)
- 5 Checking connection performance using ss command
- 6 Install and use iftop command for traffic monitoring
- 7 arp command
- 8 Packet analysis with tcpdump
Check network connectivity using the ping command
The ping command is one of the most used Linux network commands in network troubleshooting. You can use it to check whether or not a specific IP address can be reached.
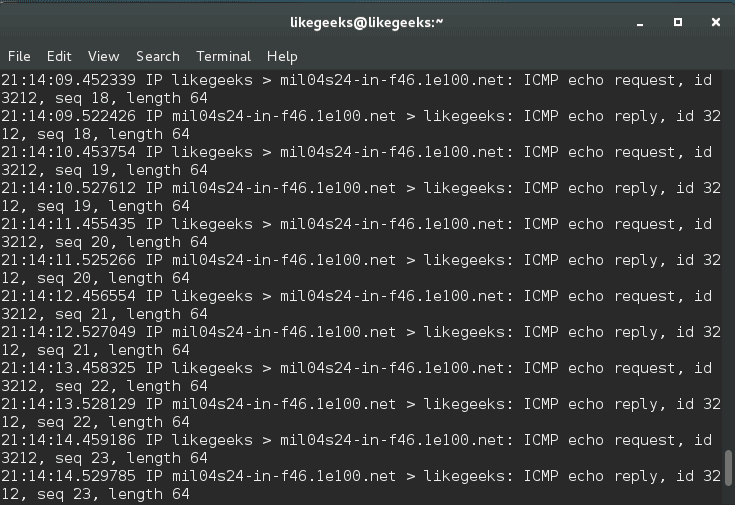
The ping command works by sending an ICMP echo request to check the network connectivity.
$ ping google.com
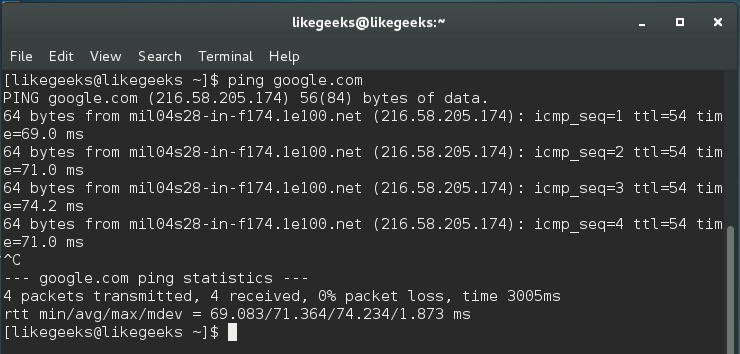
These results are showing a successful ping, and you can see that there are no issues during our packets trip to google.com.
This command measures the average response. If there is no response, then maybe there is one of the following:
- There is a physical problem on the network itself.
- The location might be incorrect or non-functional.
- The target is blocking the ping requests.
- There is a problem with the routing table.
If you want to limit the number of echo requests made to 3, you can do it like this:
$ ping -c 3 google.com
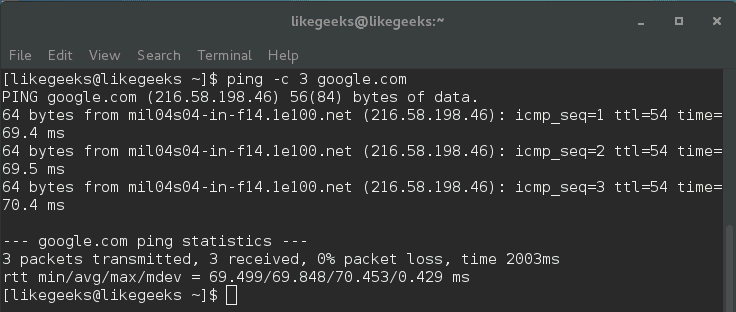
Here ping command stops sending echo requests after three cycles.
There are some issues that you should consider about the ping command. These issues may not necessarily mean that there is a problem like:
Distance to the target: so if you live in the U.S. and you ping a server on Asia, you should expect that this ping will take much time than pinging a server in the U.S.
The connection speed: if your connection is slow, ping will take a longer time than if you have a fast connection.
The hop count: this refers to routers and servers that the echo travels across till reaching its destination.
The important rule about ping is that the low ping is always desirable.
Get DNS records using dig and host commands
You can use the dig command to verify DNS mappings, host addresses, MX records, and all other DNS records for a better understanding of DNS topography.
The dig command is a replacement for the nslookup command.
$ dig google.com

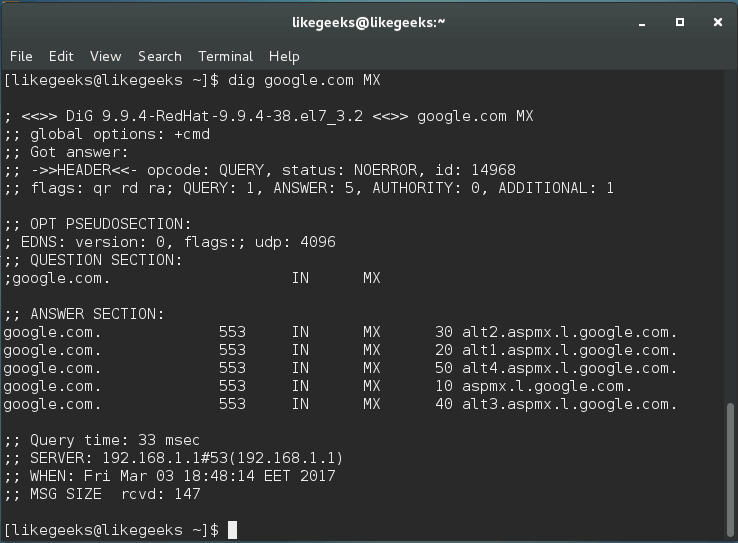
The dig command by default searches for A records, you can obtain information for specific record types like MX records or NS records.
$ dig google.com MX
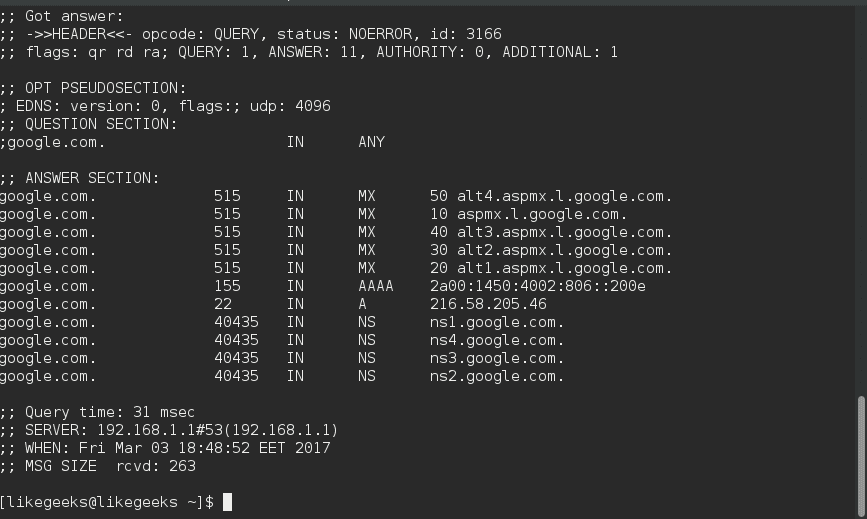
You can get all types of records by using the ANY query.
$ dig google.com ANY
The dig command makes a reverse lookup to get DNS information like this:
$ dig –x 8.8.8.8
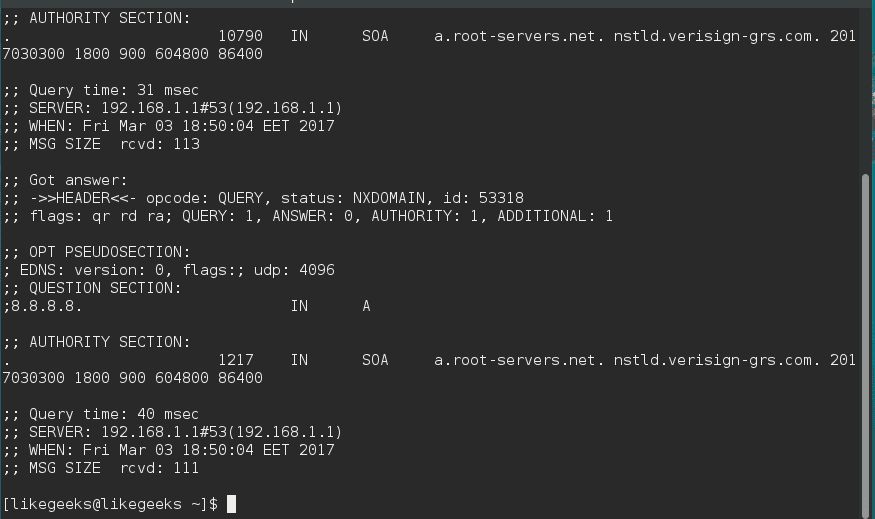
dig command does its query using the servers listed on /etc/resolv.conf.
The host command is similar to dig command.
$ host –a google.com
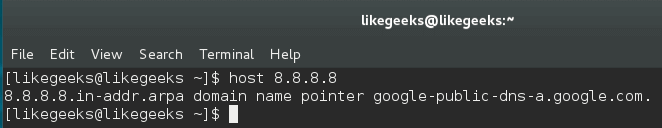
Also, you can perform reverse lookups using the host command.
$ host 8.8.8.8
So both commands work similarly, but the dig command provides more advanced options.
Diagnose network latency using traceroute command
The traceroute command is one of the most useful Linux network commands. You can use it to show the pathway to your target and where the delay comes from. This command helps basically in:
- Providing the names and the identity of every device on the path.
- Reporting network latency and identify at which device the latency comes from.
$ traceroute google.com
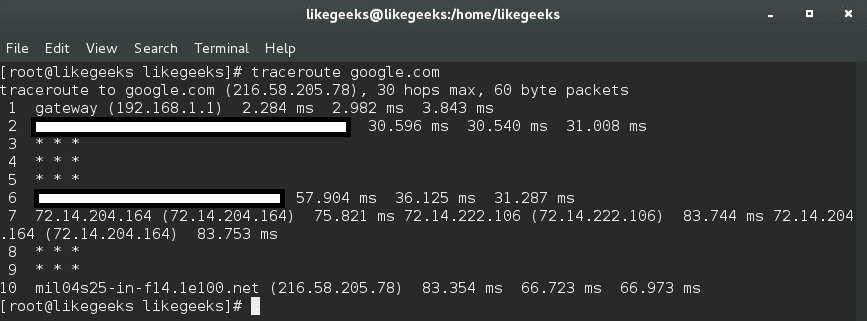
The output will provide the specified host, the size of the packet, the IP address, and the number of hops. You can see the hostname, IP address, the hop number, and packet travel times.
To avoid reverse DNS lookup, use the -n option.
$ traceroute -n google.com
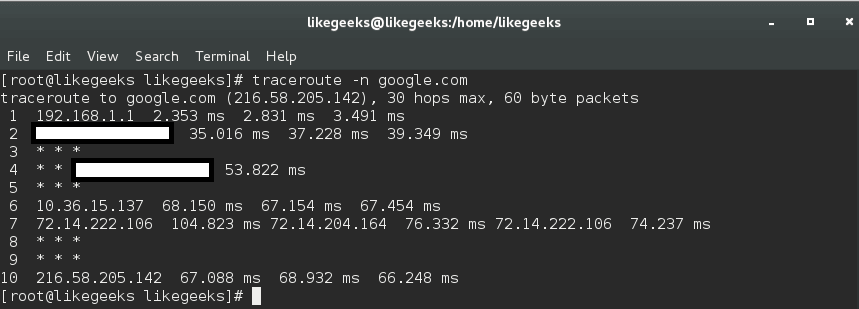
By using the traceroute command, you can identify network bottlenecks. The asterisks shown here means there is a potential problem in routing to that host, as the asterisks indicate packet loss or dropped packets.
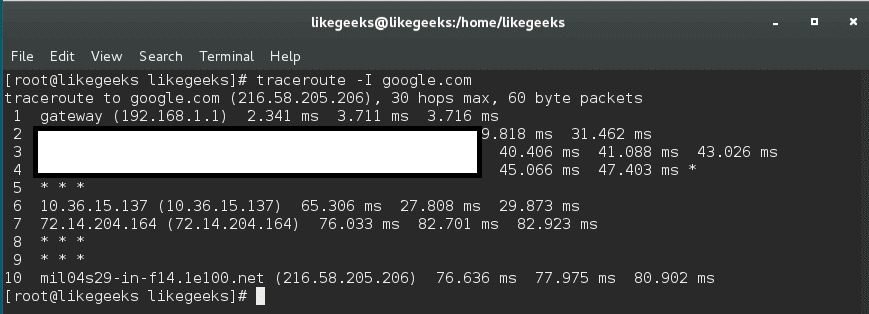
The traceroute command sends a UDP packet, traceroute can send UDP, TCP, and ICMP.
If you need to send ICMP packet, you can send it like this:
$ sudo traceroute -I google.com
To use a TCP variation, you can use it like this:
$ sudo traceroute -T google.com
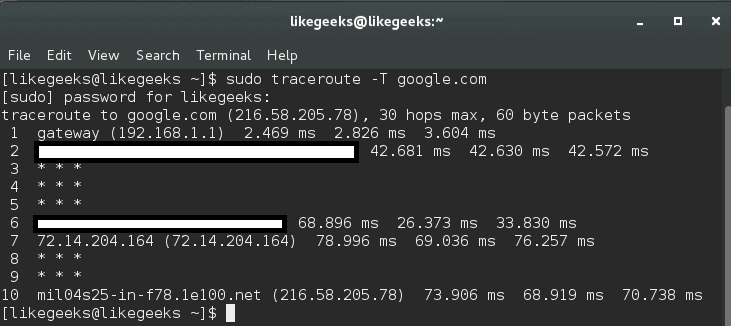
This is because some servers block UDP requests, so you can use this method.
In this case, you can send UDP, ICMP, or TCP to bypass these issues.
mtr command (realtime tracing)
This command is an alternative to traceroute command.
$ mtr google.com
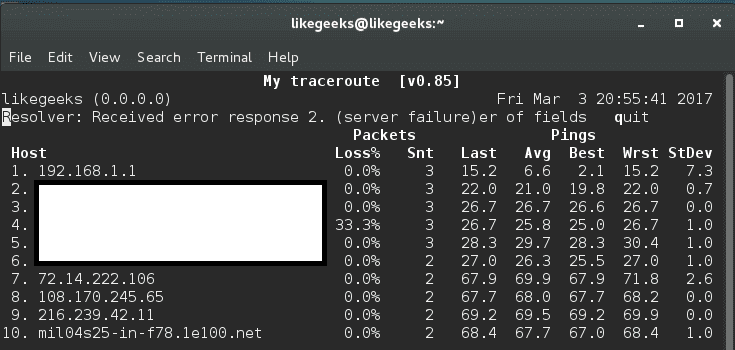
The best thing about mtr command is that it displays realtime data, unlike traceroute.
Furthermore, you can use the mtr command with –report option, this command sends ten packets to each hop found on its way like this:
$ mtr --report google.com
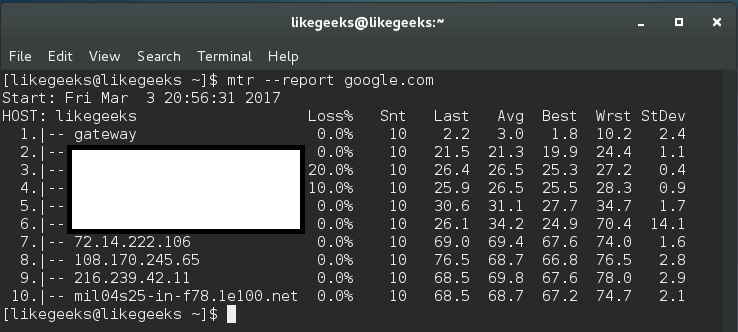
This command gives a huge amount of details better than traceroute.
If this command doesn’t run using a normal user account, you should use root, since some distros adjust the permission of this binary for root users only.
Checking connection performance using ss command
The socket statistics command ss is a replacement for netstat, it’s faster than netstat and gives more information.
The ss command gets its information directly from the kernel instead of relying on /proc directory like netstat command.
$ ss | less
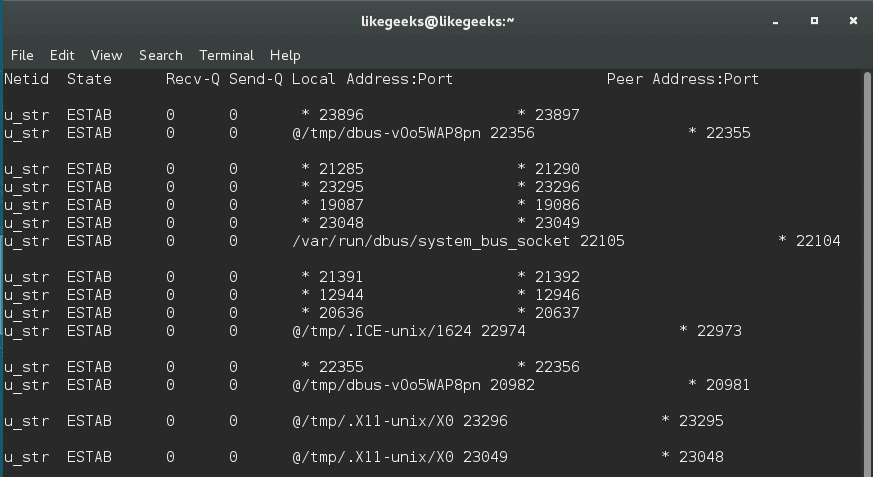
This command outputs all TCP, UDP, and UNIX socket connections and pipes the result to the less command for better display.
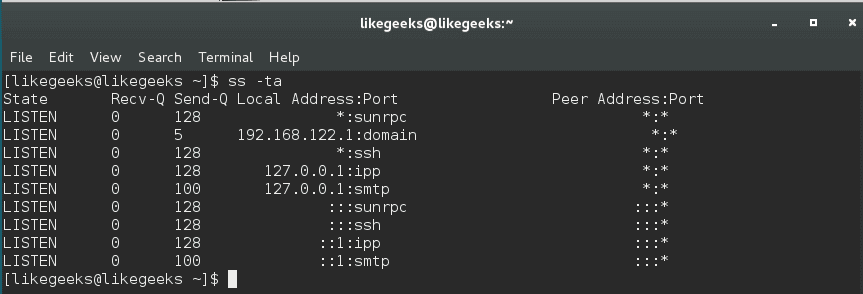
You can combine this command with either the -t to show TCP sockets or -u to show UDP or -x to show UNIX sockets. And you should use -a option combined with any of these options to show the connected and listening sockets.
$ ss -ta
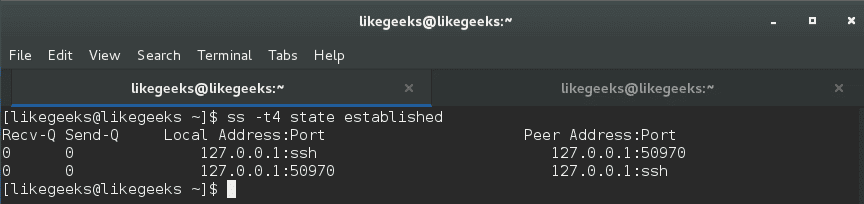
To list all established TCP sockets for IPV4, use the following command:
$ ss -t4 state established
To list all closed TCP states:
$ ss -t4 state closed
You can use the ss command to show all connected ports from a specific IP:
$ ss dst XXX.XXX.XXX.XXX
And you can filter by a specific port like this:
$ ss dst XXX.XXX.XXX.XXX:22
Install and use iftop command for traffic monitoring
You can use the iftop utility or iftop command to monitor the traffic and display realtime results.
You can download the tool like this:
$ wget http://www.ex-parrot.com/pdw/iftop/download/iftop-0.17.tar.gz
Then extract it:
$ tar zxvf iftop-0.17.tar.gz
Then compile it:
$ cd iftop-0.17

$  ./configure

$ make

$ make install
If you got any errors about libpcap, you could install it like this:
$ yum install libpcap-dev
And you can run the tool as a root user like this:
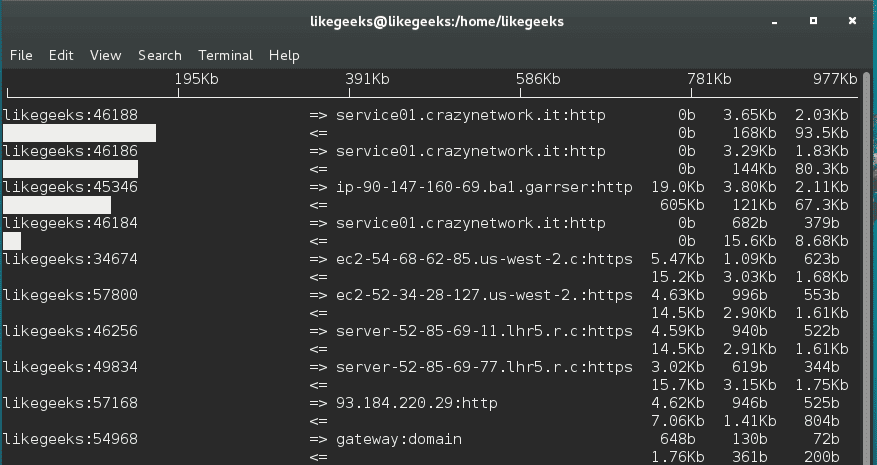
$ sudo iftop -I <interface>
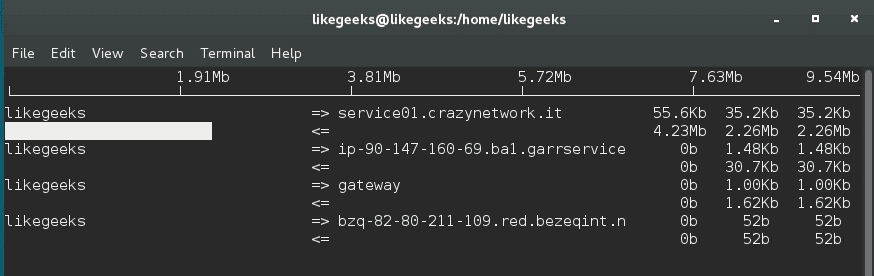
And you will see this table with realtime data about your traffic.
Add –P option with iftop to show ports.
$ sudo iftop -P
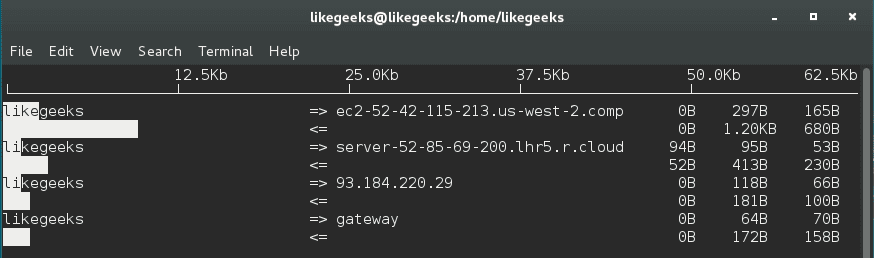
You can use the -B option to display the output in bytes instead of bits, which is the default.
$ iftop -B
There a lot of options, you can check them.
man iftop
.
arp command
Systems keep a table of IP addresses and their corresponding MAC addresses; this is the ARP lookup table. If you try to connect to an IP address, your router will check for your MAC address. If your system caches it, the ARP table is not used.
To view the arp table, use the arp command:
$ arp
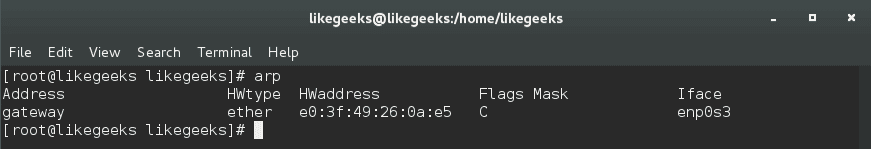
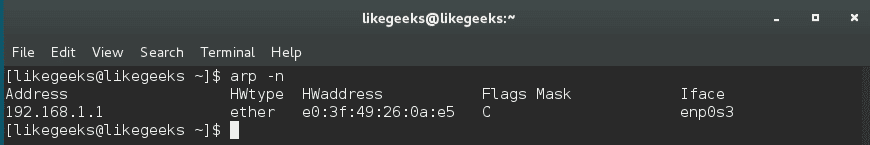
By default, arp command shows the hostnames, you can show IP addresses instead like this:
$ arp -n
You can delete entries from the arp table like this:
$ arp -d HWADDR
Packet analysis with tcpdump
One of the most important Linux network commands is the tcpdump command. You can use the tcpdump command to capture the traffic that is passing through your network interface.
This kind of access to the packets, which is the deepest level of the network can be vital when troubleshooting the network.
$ tcpdump -i <network_device>
You can also specify a protocol (TCP, UDP, ICMP, and others) like this:
$ tcpdump -i <network_device> tcp
Also, you can specify the port:
$ tcpdump -i <network_device> port 80
tcpdump will keep running until you cancel it; it is better to use the -c option to capture a pre-determined number of events like this:
$ tcpdump -c 20 -i <network_device>
You can also specify the IP to capture from using the src option or going to using the dst option.
$ tcpdump -c 20 -i <network_device> src XXX.XXX.XXX.XXX
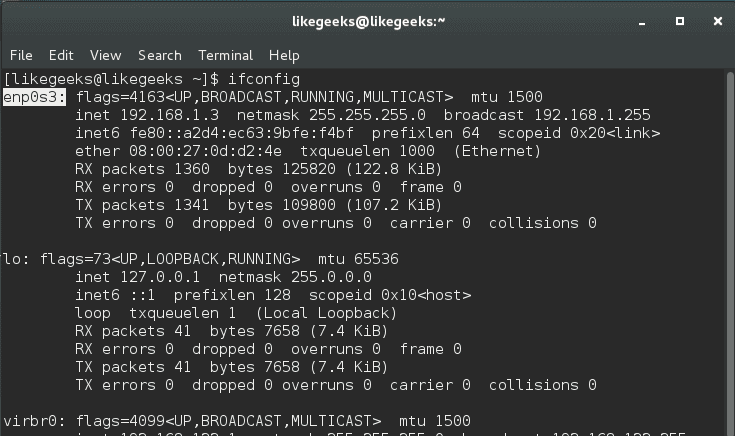
You can obtain the device names like this:
$ ifconfig
You can save the traffic captured from tcpdump to a file and read it later with -w option.
$ tcpdump -w /path/ -i <network_device>
And to read that file:
$ tcpdump -r /path
I hope that the Linux network commands we’ve discussed in this post could help you troubleshoot some of your network problems and make the right decision.
Thank you.
Mokhtar is the founder of LikeGeeks.com. He is a seasoned technologist and accomplished author, with expertise in Linux system administration and Python development. Since 2010, Mokhtar has built an impressive career, transitioning from system administration to Python development in 2015. His work spans large corporations to freelance clients around the globe. Alongside his technical work, Mokhtar has authored some insightful books in his field. Known for his innovative solutions, meticulous attention to detail, and high-quality work, Mokhtar continually seeks new challenges within the dynamic field of technology.
you forgot netcat, not sure how since it’s the network swiss army knife.